Appearance
Time-Dependent Results
ParaView supports time-dependent (transient) simulation data, allowing you to visualize how fields evolve over time — such as wave propagation, heat diffusion, or structural deformation sequences.
Playing Through Time Steps
When you load a dataset containing multiple time steps (for example, .xdmf or .pvd files), ParaView automatically detects them.
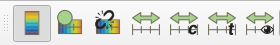
- Use the Play and Pause buttons on the top toolbar to animate your results over time.
- The Next Frame and Previous Frame buttons let you move step by step.
- The Animation Time Slider below the Render View shows the current time step and allows quick navigation.

You can control playback speed and looping options from the Animation View (accessible via View → Animation View).
Adjusting Color Scales
As field values may vary significantly between time steps, it’s important to manage the color map scaling:
- Click Rescale to Data Range Over Time (color bar options) to adjust the color range based on all time steps.
- Alternatively, fix the color scale using Rescale to Custom Range for consistent comparison across frames.
- For dynamic visualizations, enable Automatic Rescale so the range updates automatically as the animation plays.
Summary
By combining the Play controls and custom color scaling, ParaView makes it easy to visualize and analyze time-varying simulations smoothly. This helps you observe trends, transient behaviors, and evolving physical phenomena with clarity and precision.