Appearance
Pipeline & Interface Overview
ParaView is a powerful and versatile tool for visualizing simulation results and performing post-processing. It provides a range of filters and visualization options that help you analyze large datasets interactively — from field distributions and contour plots to time-dependent animations.
Understanding ParaView’s interface and the Pipeline Browser is key to using it efficiently.
Interface Overview
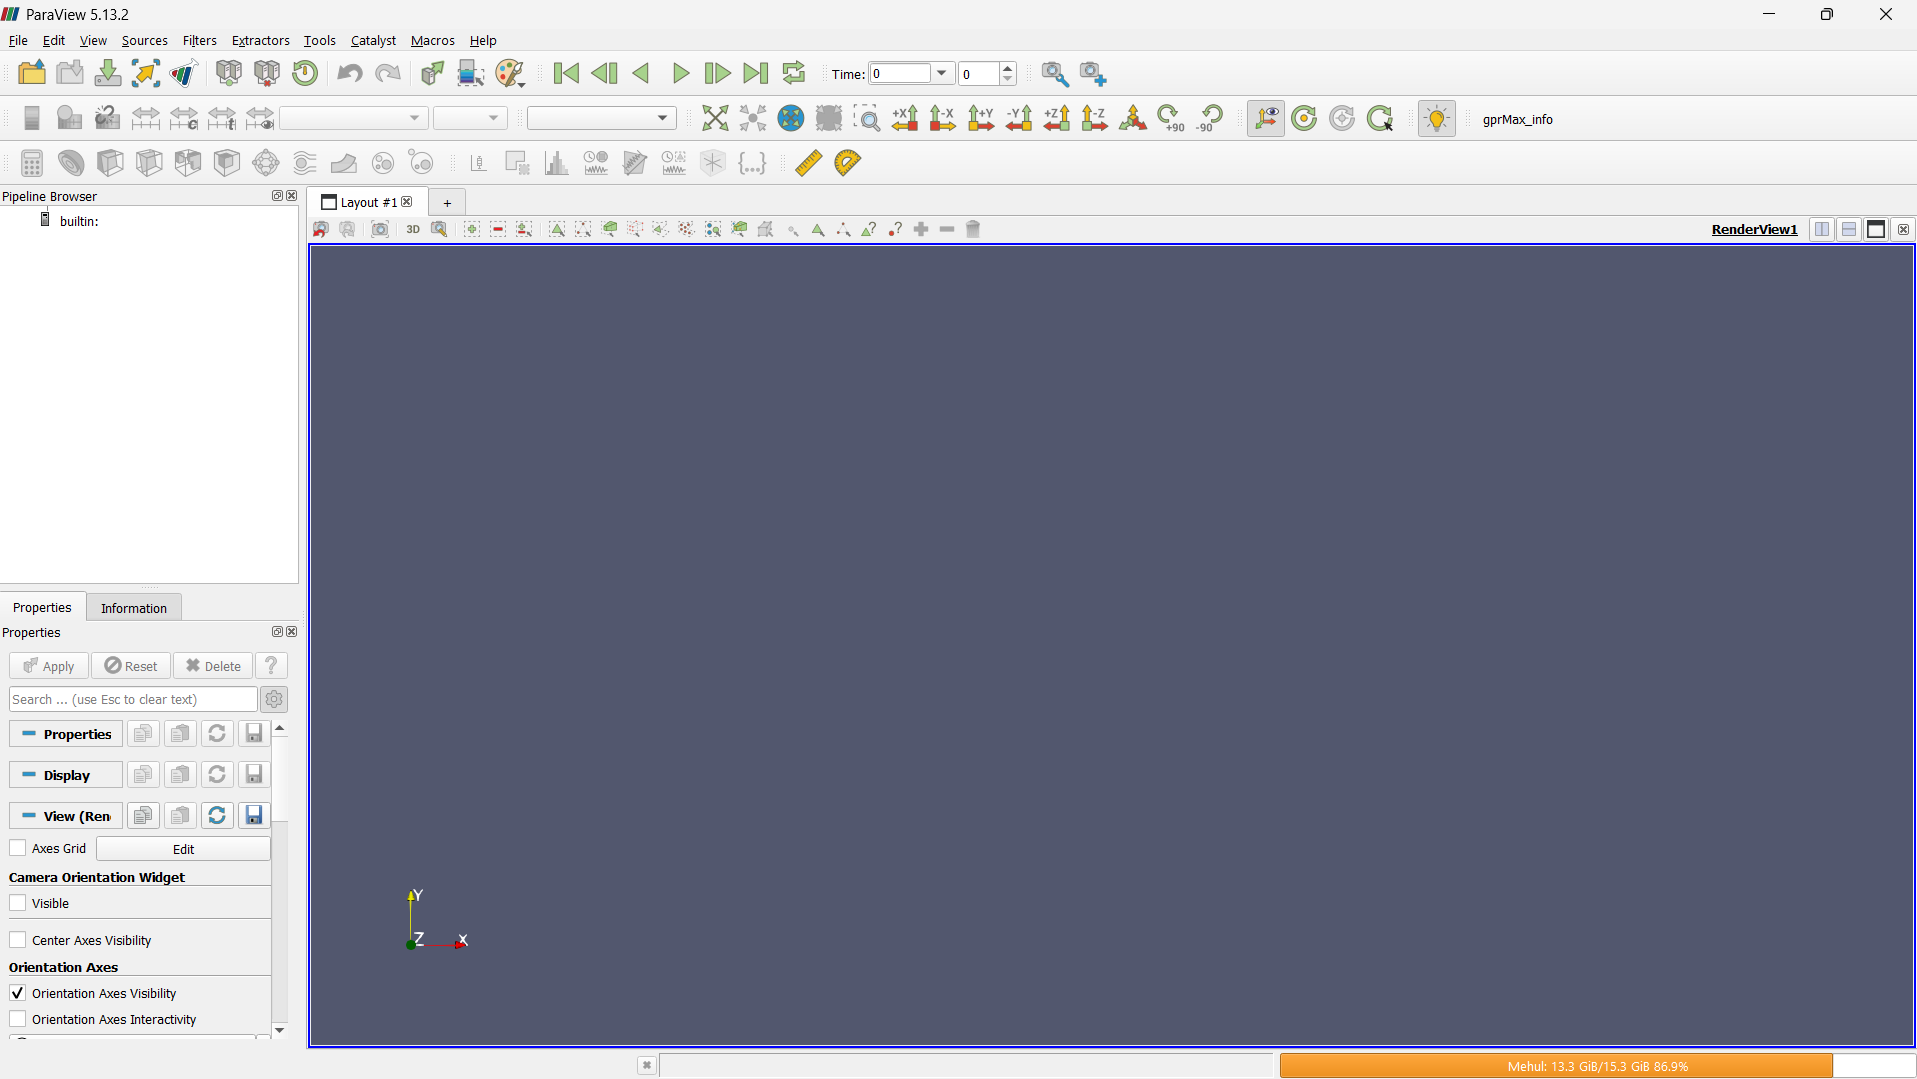
When you launch ParaView, you’ll see several core components arranged around the main 3D Render View.
1. Menu Bar
Located at the top of the window, the Menu Bar includes drop-downs for:
- File – open, save, or export datasets and visualizations.
- Edit – undo/redo operations and manage settings.
- View – toggle visibility of panels like Pipeline Browser, Properties, or Color Map Editor.
- Filters – access the full list of filters for post-processing.
- Tools & Help – manage plugins, scripting options, and documentation.

2. Main Toolbar
Just below the menu bar, the Toolbar provides quick access to common tools:
- Connect/Disconnect from a remote server.
- Play/Pause controls for time-dependent simulations.
- Variable selection drop-downs to choose which field (e.g., electric field, displacement, temperature) to display.
- Camera controls for rotation, zoom, and orthogonal view alignment.
- Lighting and color map controls to adjust how your results are rendered.
- Common Filter Shortcuts for quick access to frequently used filters such as: Slice, Clip, Threshold, Glyph, Contour

These toolbar buttons let you apply essential filters with a single click, streamlining your workflow for typical engineering and scientific tasks.
3. Pipeline Browser
On the left-hand side, the Pipeline Browser shows your active data sources and the sequence of filters applied. Each entry represents a node in the dataflow — beginning with the imported dataset and followed by filters (like Clip, Slice, or Warp by Scalar).

The order here reflects the logical data processing pipeline — from input to the final visualization.
4. Properties and Display Panels
Below the Pipeline Browser is the Properties Panel, where you can configure parameters for the selected object or filter.
- The Properties section controls filter-specific options.
- The Display section adjusts visualization settings such as color mapping, opacity, and representation (surface, wireframe, points, etc.).
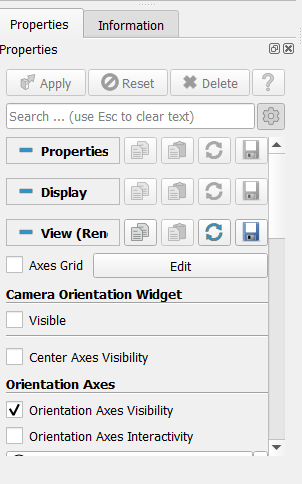
Remember to click Apply after making changes — filters are only executed when you apply them.
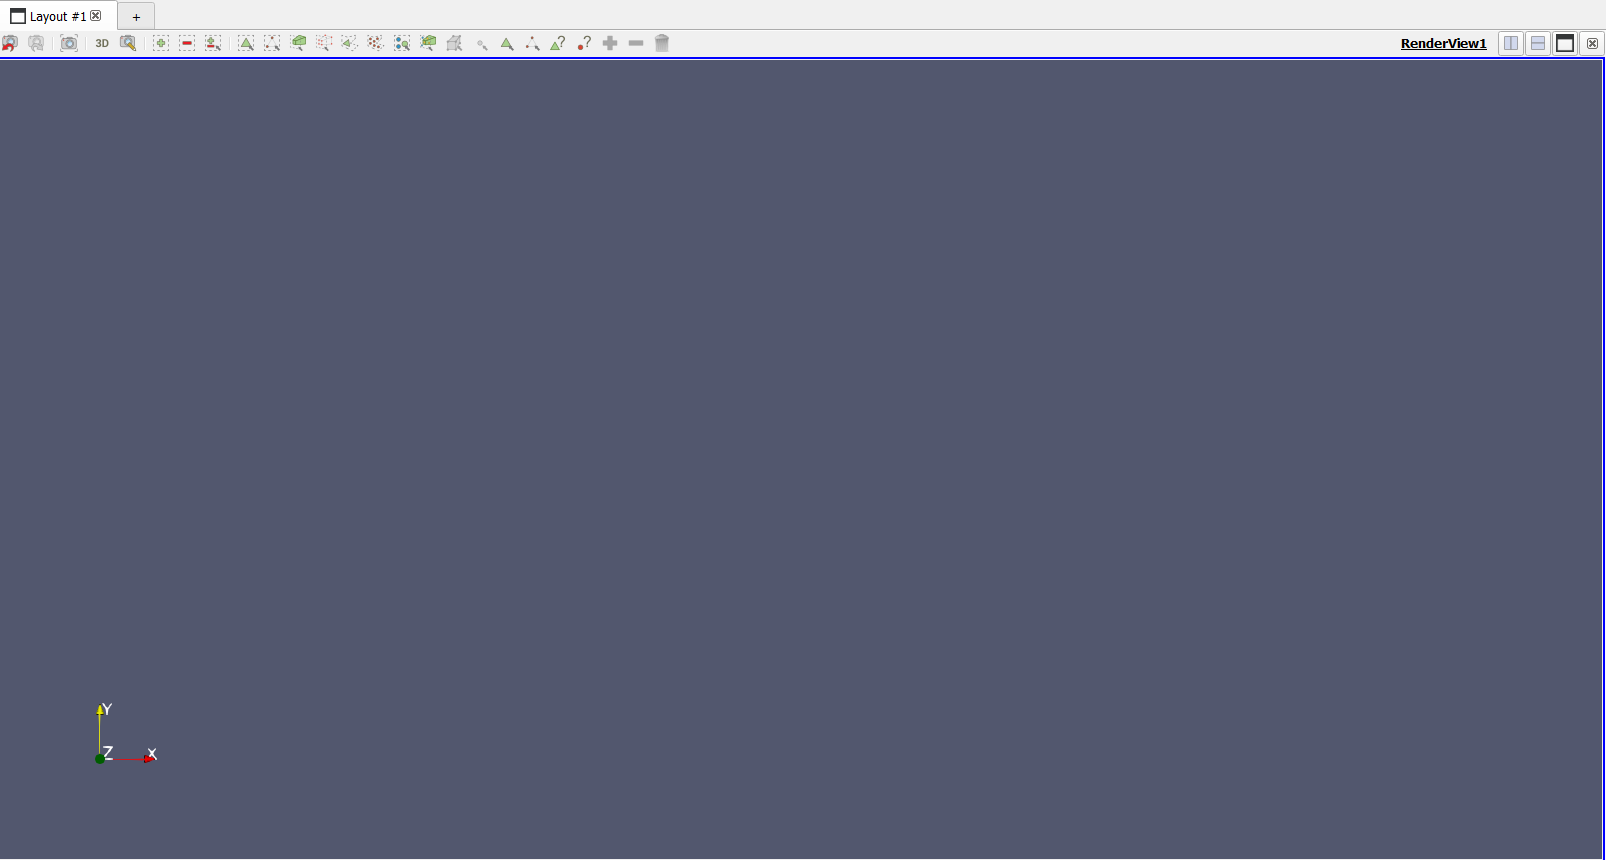
5. Render View
At the center is the Render View, which displays your data visually. You can:
- Interactively rotate, pan, and zoom using your mouse.
- Show or hide elements from the pipeline.
- Split views to compare multiple visualizations side-by-side.
Understanding the Pipeline
ParaView’s data processing follows a pipeline-based model. Each action — opening a file, applying a filter, or modifying a visualization — adds a new step to the pipeline.
- Readers/Sources import data (e.g.,
.xdmf,.vtu,.vtk, or.csvfiles). - Filters process or modify that data (e.g., Clip, Slice, Threshold, Contour).
- Display Settings define how the processed data appears in the Render View.
Order of Filters
The order in which filters are applied directly affects your results. For example, slicing before thresholding gives a different output than thresholding first.
- Always select the correct node in the Pipeline Browser before adding a filter — the new filter attaches to that selected node.
- Branching is allowed — you can apply multiple filters to the same data source to explore different visualizations in parallel.
- To experiment safely, you can toggle the visibility of filters (eye icon) without deleting them.
Summary
The ParaView interface is designed for a logical, step-by-step workflow: Load data → Apply filters → Adjust properties → Visualize and analyze.
At the heart of this process is the Pipeline Browser, which organizes how your data moves through various transformations and filters.
In the following sections, we will explore how to use ParaView’s filters in practice, guiding you through typical workflows and hands-on examples.