Appearance
Plotting & Extracting Data
ParaView not only visualizes simulation results but also allows you to analyze and extract quantitative data directly from your models. This helps in validating your results, checking field variations, and preparing data for reports or further analysis.
Plotting Data
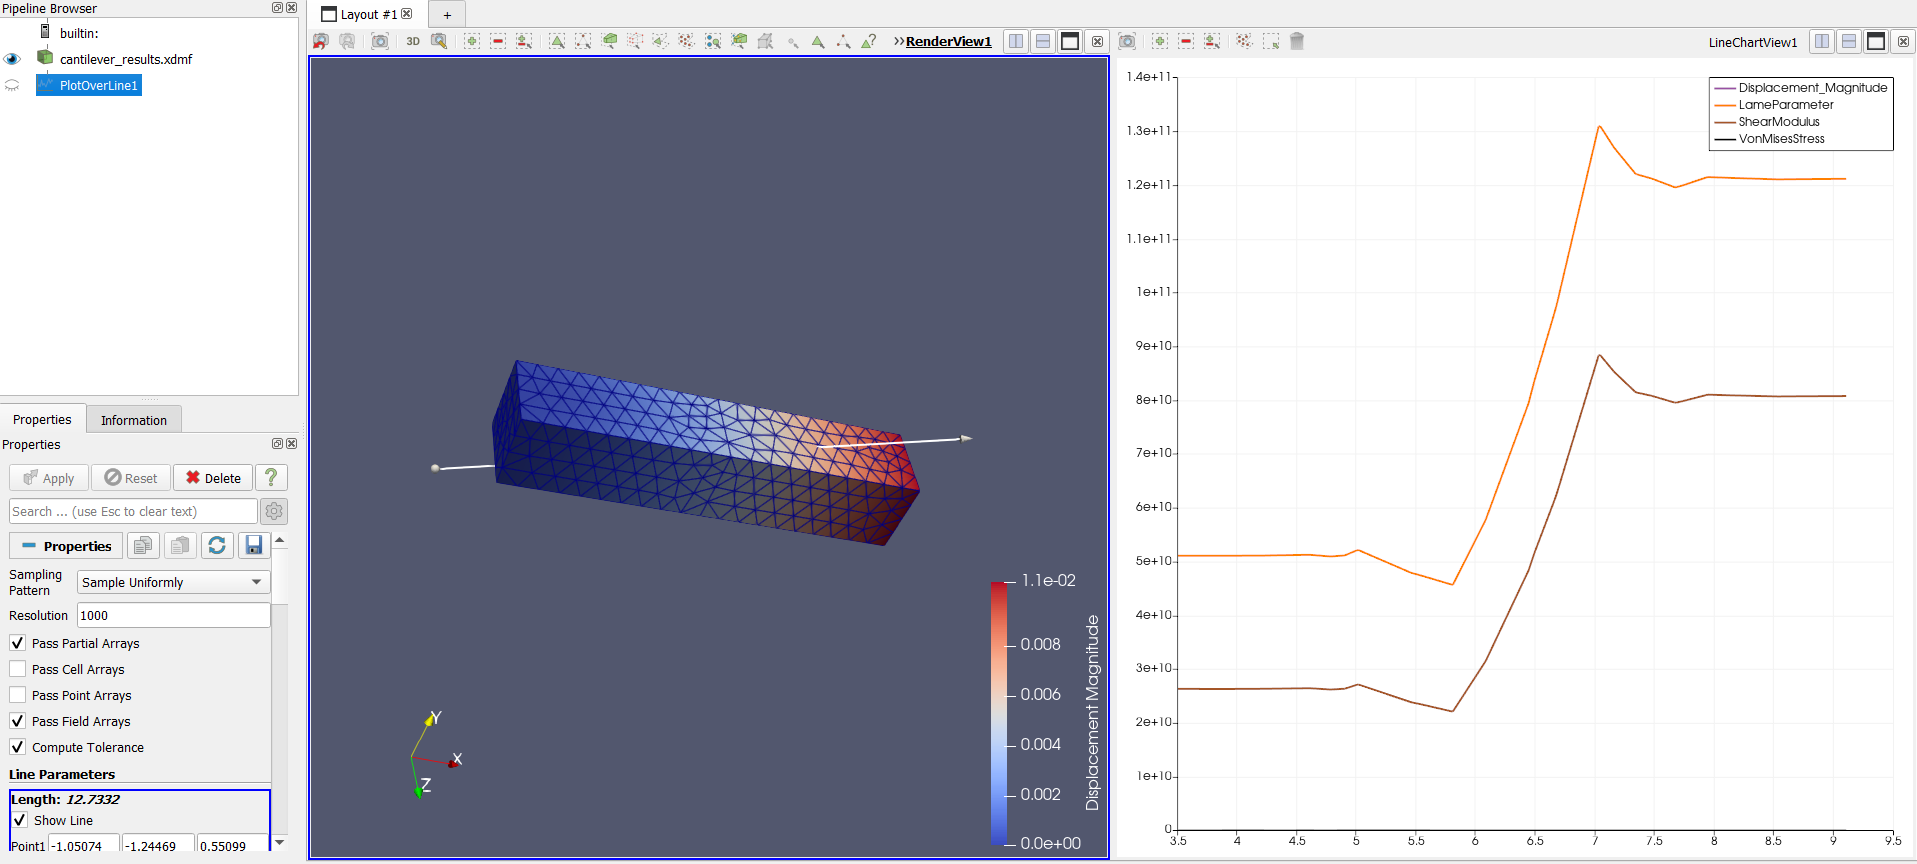
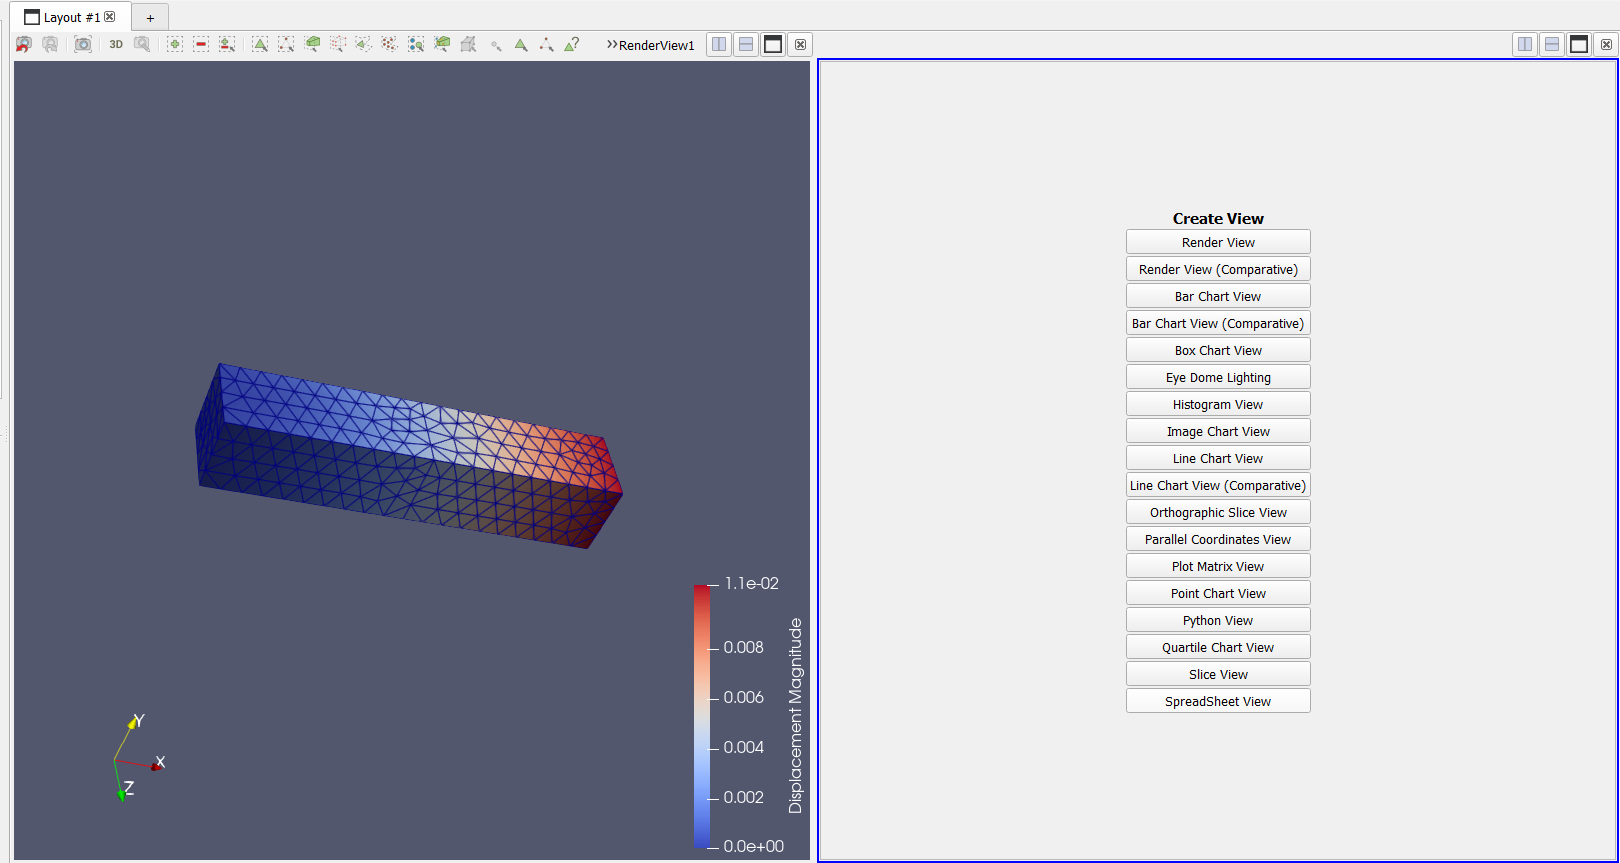
- Plot Over Line: Use Filters → Data Analysis → Plot Over Line to draw a line through your model and plot field values (like temperature, stress, or electric field) along that line. Ideal for analyzing gradients or distributions.
- Spreadsheet View: Switch to Spreadsheet View to see exact numerical values at each node or element. You can sort, filter, or copy the data for verification.
Extracting Data
To export numerical data for external tools (like Python, MATLAB, or Excel):
- Select the dataset or filter in the Pipeline Browser.
- Go to File → Save Data.
- Choose the format —
.csv,.txt, or.vtu.
Summary
Plotting and extracting data in ParaView bridges the gap between visual insights and quantitative validation. It allows you to examine trends, verify results, and share precise numerical outputs alongside your visualizations.