Appearance
Visualizing Scalar Fields
Scalar fields — such as temperature, pressure, electric potential, or stress magnitude — are among the most common outputs in computational simulations. ParaView provides multiple ways to visualize these fields clearly and effectively.
Displaying a Scalar Field
- Load your dataset (e.g.,
.vtu,.xdmf, or.vtk) and click Apply in the Properties Panel. - In the Toolbar, use the Color By drop-down menu to select the scalar field you want to visualize (for example,
Temperature,E_z, orVon_Mises_Stress).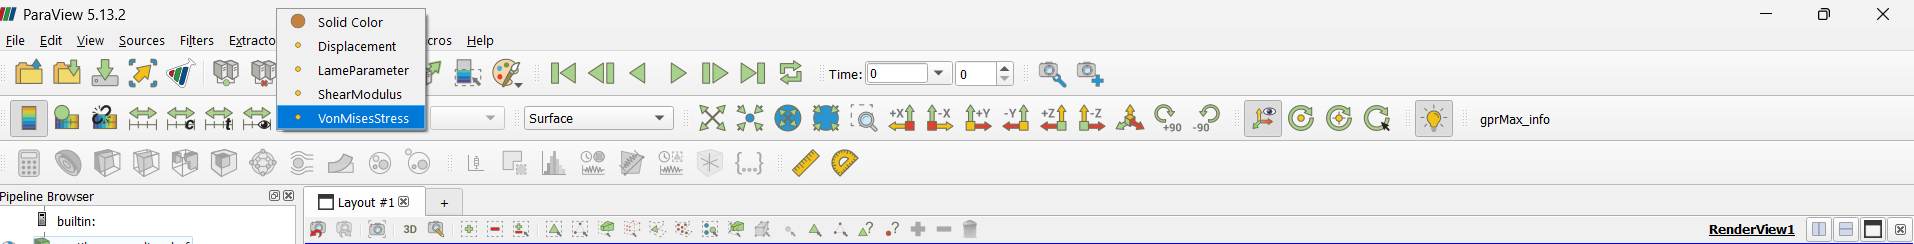
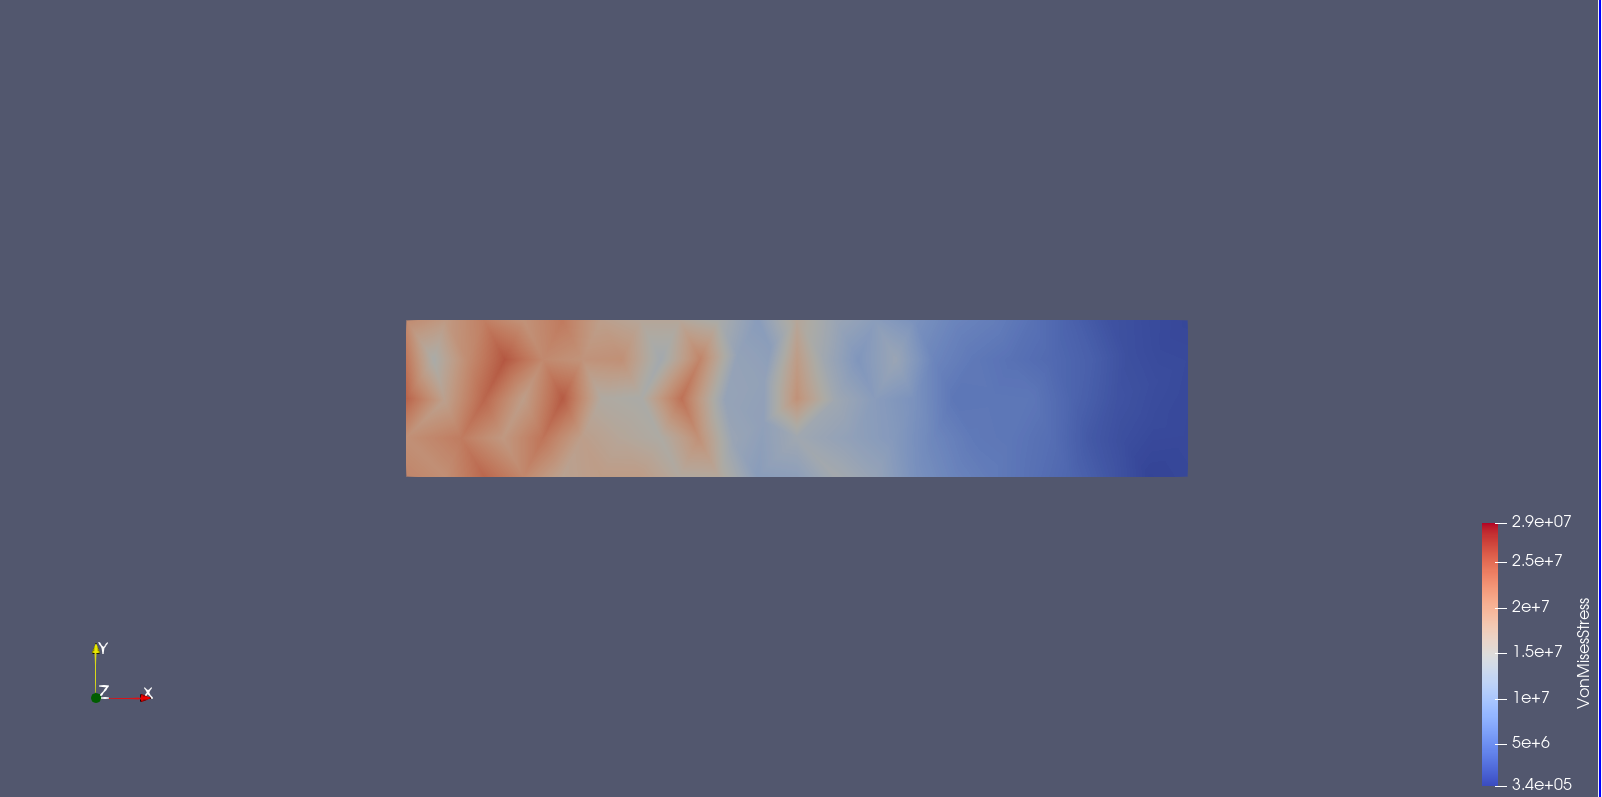
- The mesh will now be colored according to the selected field values.
- Use the color bar on the right to interpret the value scale or rescale it for better contrast.
Adjusting the View
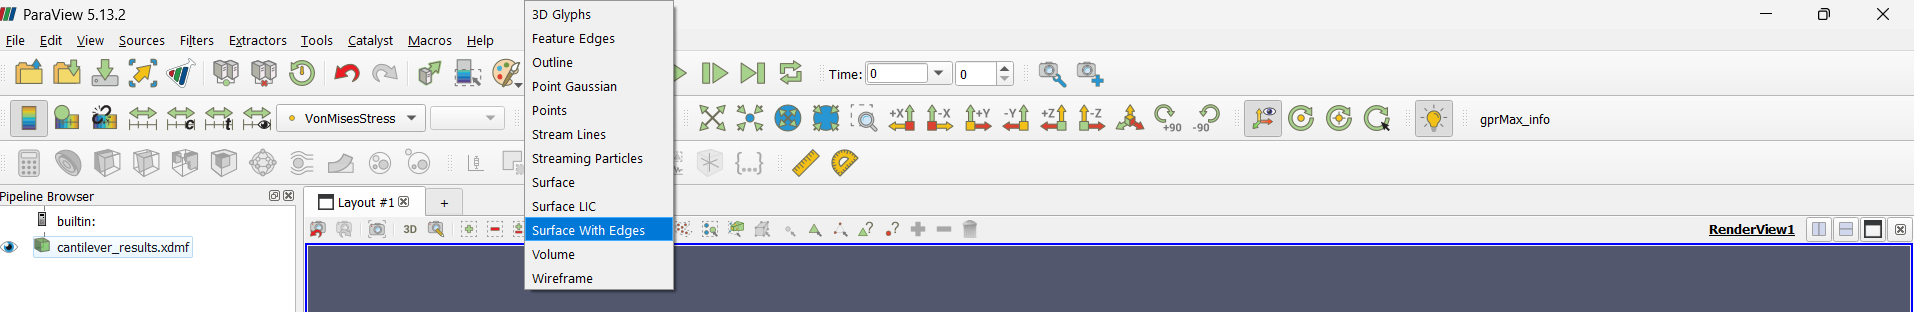
- Use Surface or Surface with Edges view for better boundary visualization.
- Go to the Properties Panel → Display section to adjust opacity, lighting, and color map.
- Click Rescale to Data Range to automatically fit the color map to your data values.
Summary
Visualizing scalar fields in ParaView helps you quickly interpret spatial variations and physical trends in your simulation. By combining color maps, slices, and thresholds, you can create clear, publication-ready visualizations that highlight key results effectively.