Appearance
Visualizing Vector Fields
Vector fields — such as velocity, electric field, or displacement — represent both magnitude and direction across your simulation domain. ParaView provides several tools to visualize these effectively.
Displaying a Vector Field
- Load your dataset and click Apply in the Properties Panel.
- In the Toolbar, use the Color By drop-down menu to select the vector field (e.g.,
E,Velocity, orDisplacement).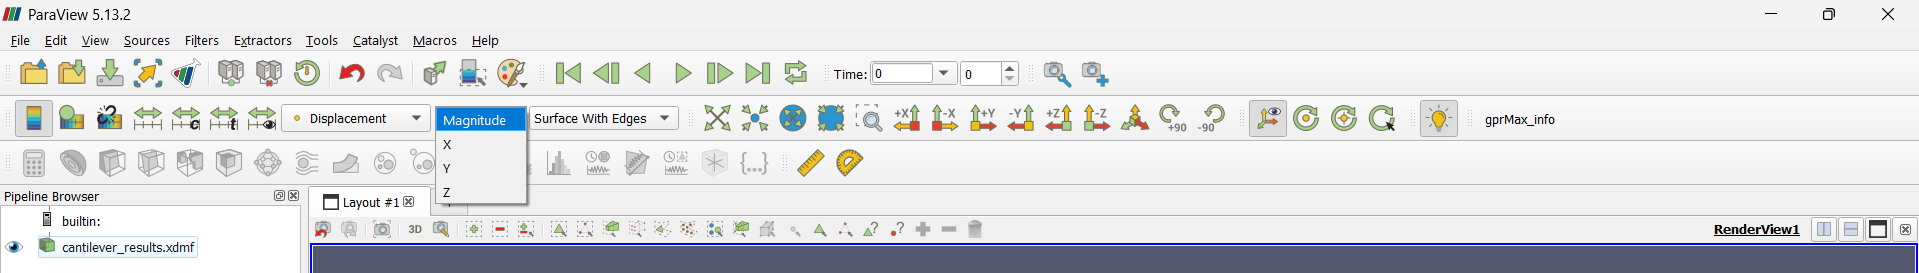
- ParaView will color the mesh by the magnitude of the vector by default. To visualize direction, apply one of the vector visualization filters.
Common Filters for Vector Visualization
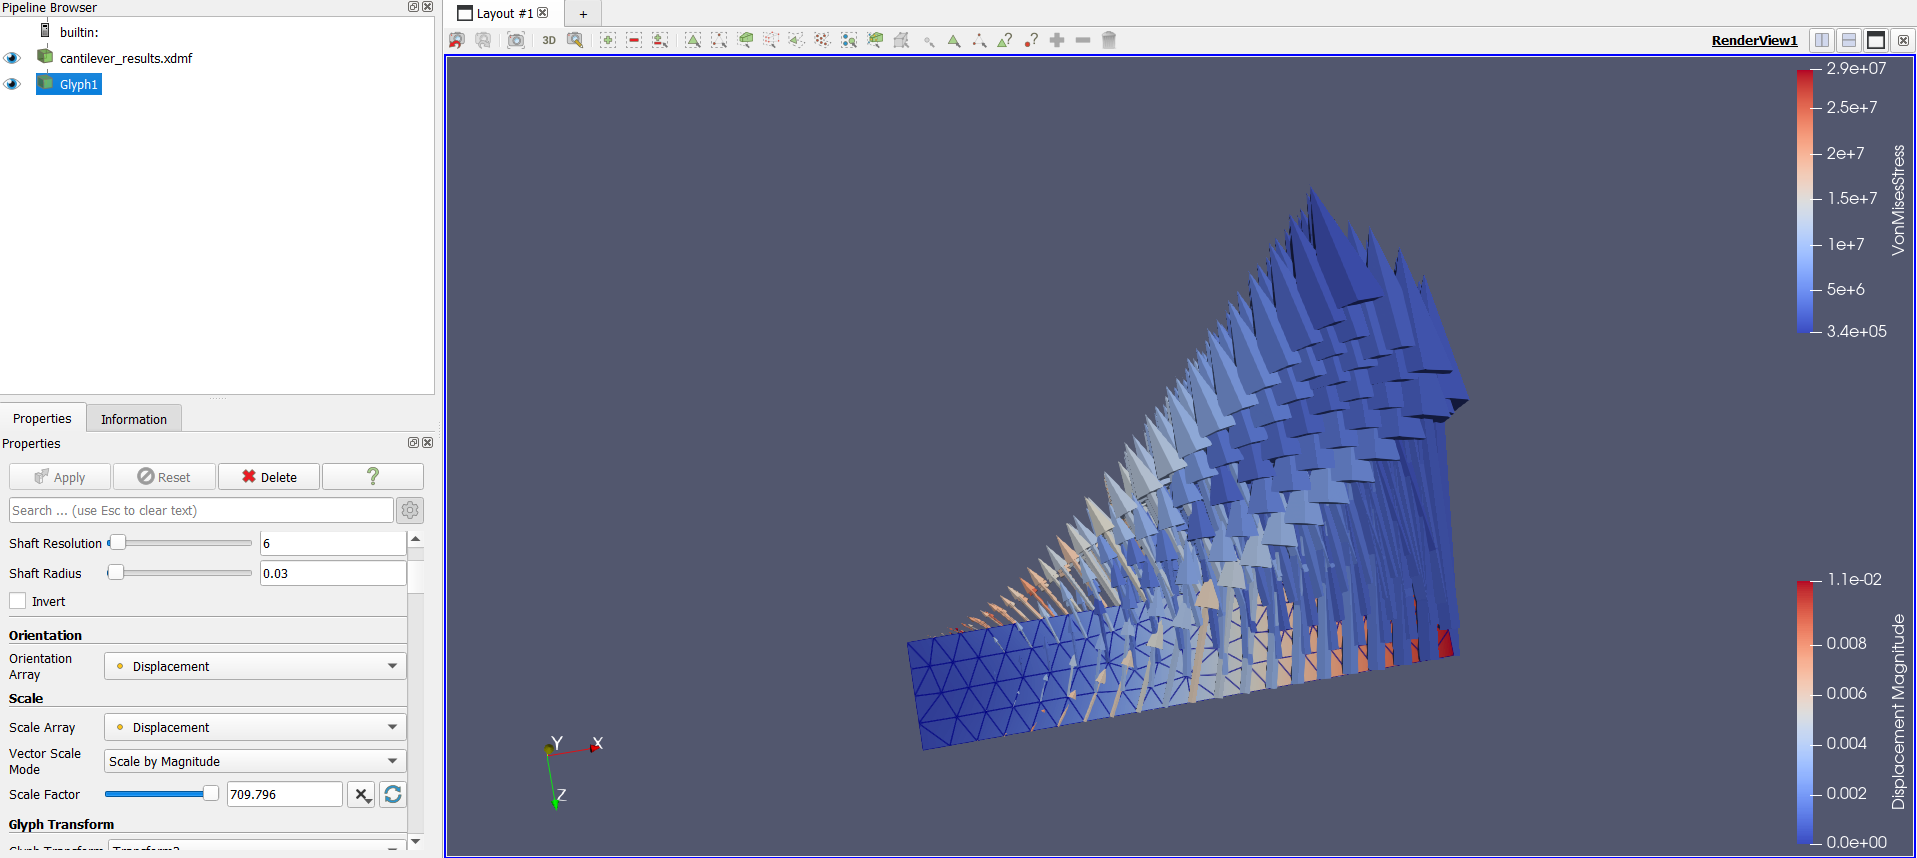
Glyph Filter:
- Go to Filters → Alphabetical → Glyph.
- Choose the vector field (e.g.,
E,Displacement, orVelocity) as the input. - Adjust the Scale Factor to control arrow size.
- The arrows indicate vector direction and relative magnitude.
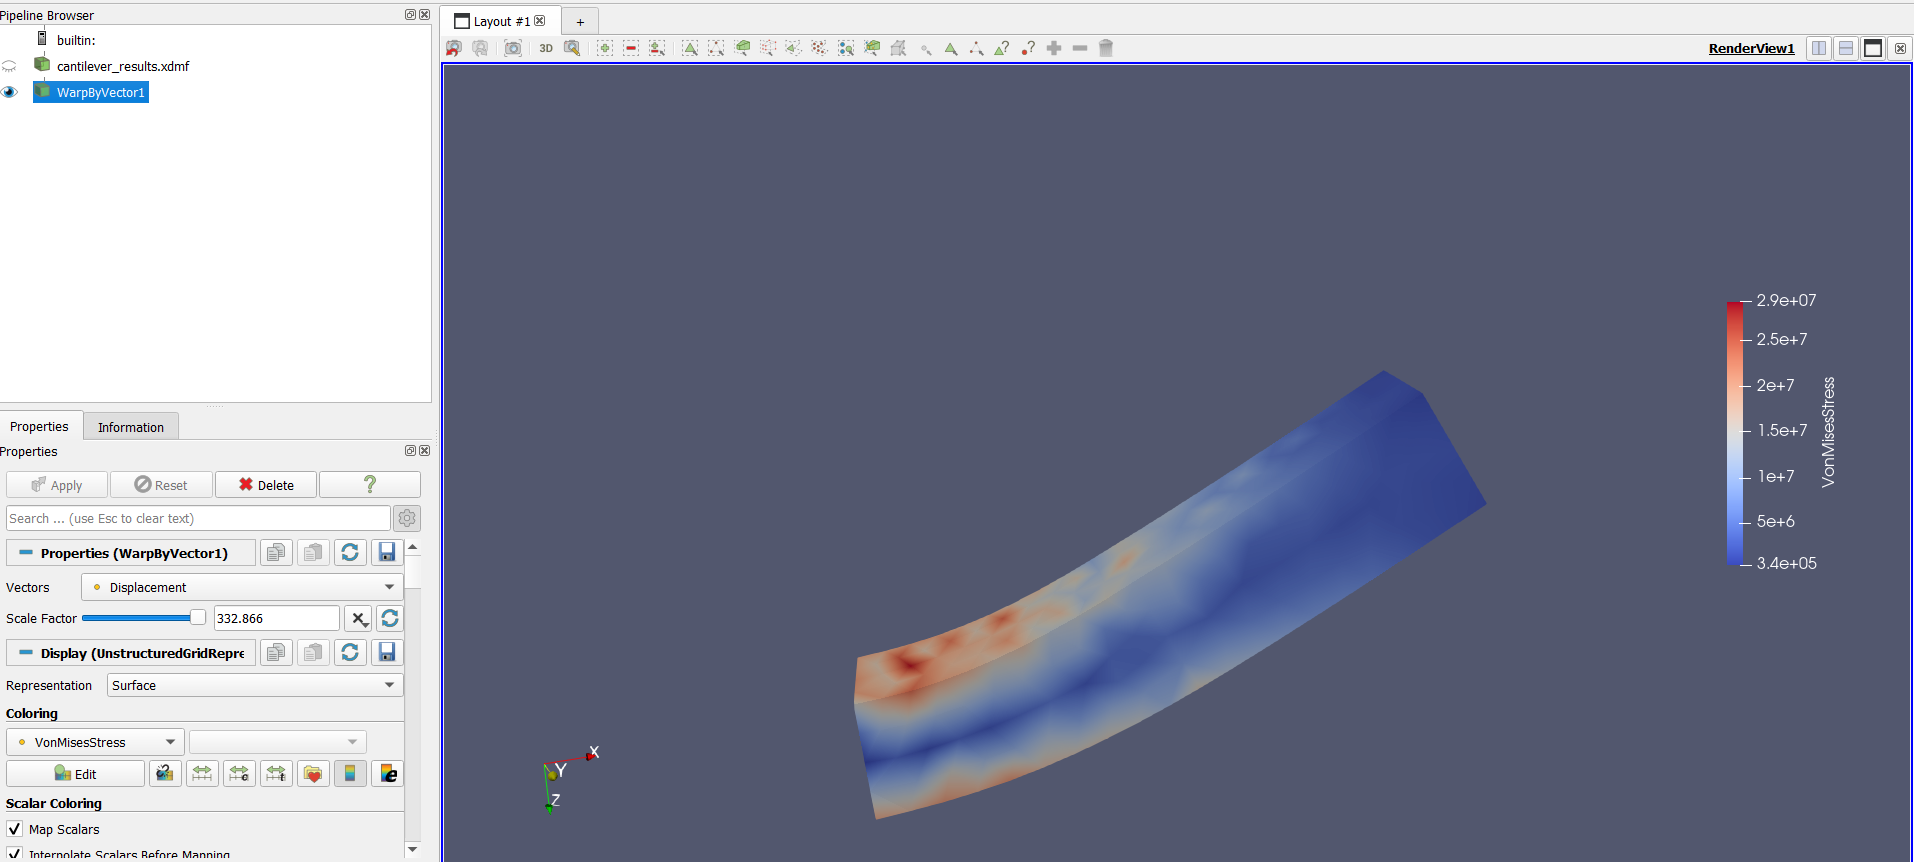
Warp by Vector:
- Deforms the geometry based on the displacement or field vector, useful for showing deformations in structural simulations.
- Deforms the geometry based on the displacement or field vector, useful for showing deformations in structural simulations.
Summary
Vector field visualization in ParaView allows you to analyze both directional behavior and field strength simultaneously. By using filters like Glyph, Stream Tracer, and Warp by Vector, you can create intuitive visualizations that reveal the underlying physics of your simulation results.