Objective of the study
- Studying different material models available in ABAQUS v.6.9.
- Modelling structural elements and seismic condition in ABAQUS v6.9 for conducting the non-linear analysis.
- Studying the effect of material model parameters and mesh on analysis results.
- Conducting a comparative study of the material models of concrete and proposing the best suited model of concrete for the purpose of seismic analysis.
Effect of mesh density on displacement field
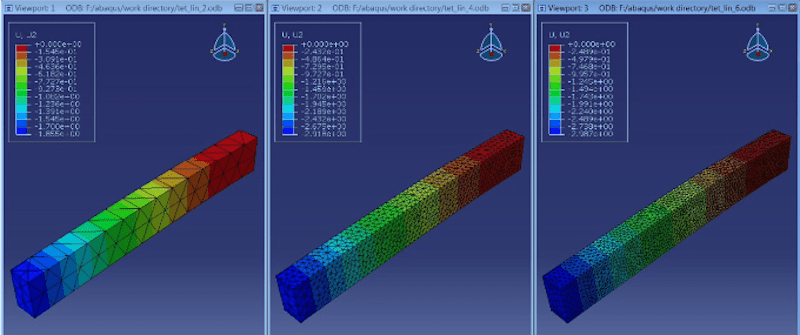
| Displacement | Ele_size = 300mm | 200mm | 100mm |
|---|---|---|---|
| Linear Hexahedral | 3.509mm | 3.501mm | 3.069mm |
| Quadratic Hexahedral | 2.761mm | 3.051 mm | 3.058mm |
| Linear Tetrahedral | 1.855mm | 2.918mm | 2.987mm |
| Quadratic Tetrahedral | 2.798mm | 3.065mm | 3.086mm |
Now, let’s make an important observation: By meshing a part with a certain type of element and using a certain size and shape, we impose additional constraints on the part. The meshed part must conform to applied loads and restraints. But being meshed, it must also conform to constraints imposed by meshing. In other words, deformation must satisfy loads and restraints and be piecewise linear. Because the meshed part has the additional constraints, the process of meshing makes it stiffer.
The amount of additional stiffness depends on the element and their size. First-order elements require that the displacement field be piecewise linear. This is more restrictive than in second-order elements where the displacement field must be piecewise parabolic. Larger elements add more stiffness than small ones. However, the effect of added stiffness (call it artificial stiffness) always accompanies finite-element models. The effect of artificial stiffness is small but demonstrable in most cases, even with a reasonably well-refined mesh.
Finite Element Model Development
This chapter aims at:-
- Briefly discussing the procedure adapted by ABAQUS v6.9 for the non-linear analysis of a structure.
- Validating the chosen material models and constitutive relations, by comparing the simulated results with experimental results.
- Presenting the stress analysis results of beams and columns.
- Studying parameters influencing the response of the structural member such as tension stiffening, damage ratios etc.
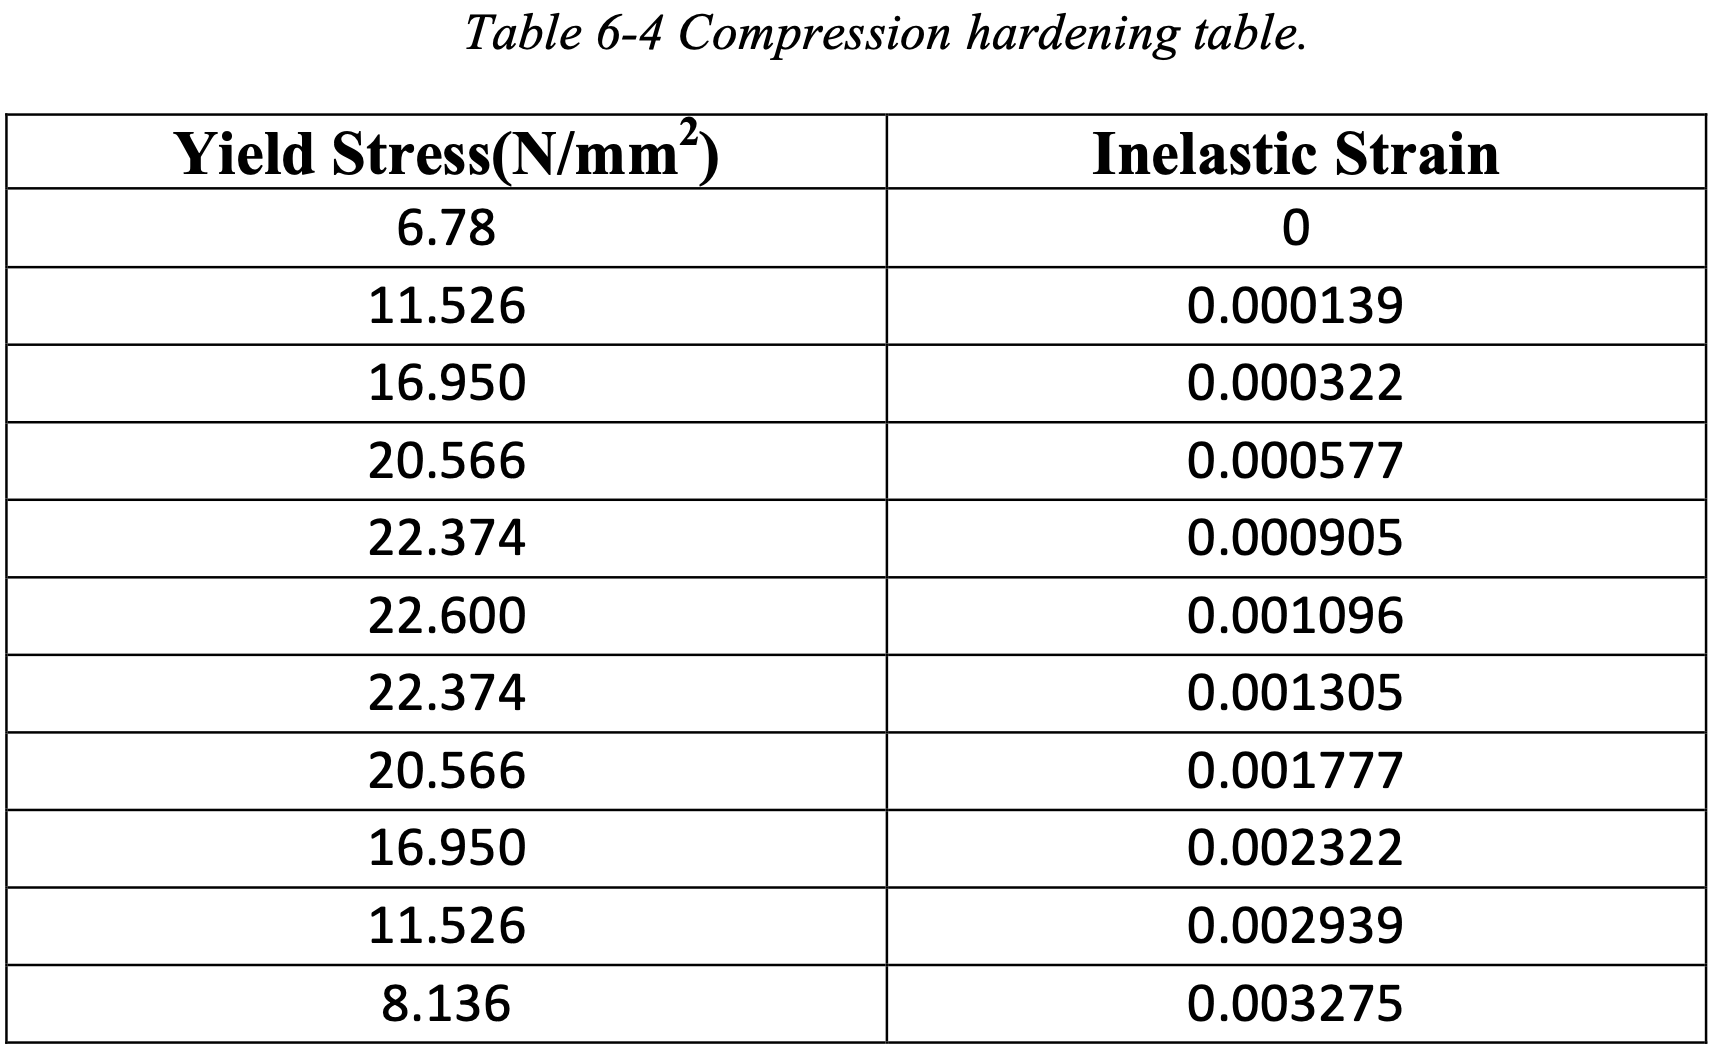
Compressive behavior: Vecchio and Collins (1982) recommended a stress–strain relationship, for transversely cracked concrete:
\(f_{2}=f_{2 \max }\left[2\left(\frac{\varepsilon_{2}}{\varepsilon_{o}}\right)-\left(\frac{\varepsilon_{2}}{\varepsilon_{o}}\right)^{2}\right]\) \(f_{2 \max }=\frac{f^{\prime} c}{0.8+170 \varepsilon_{1}}\)
where \(\epsilon_1\), is the average transverse strain measured on a gauge length that includes one or more cracks and \(\epsilon_2\) is the strain at the highest point in the compressive stress–strain curve, which is taken as 0.002. The term in brackets describes a parabolic stress–strain curve with apex at \(\epsilon_0\) and a peak stress that decreases as \(\epsilon_1\) increases.
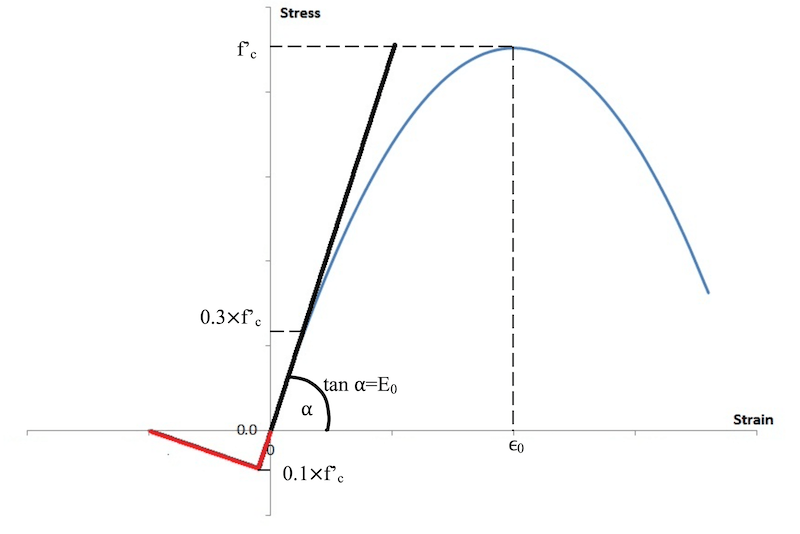
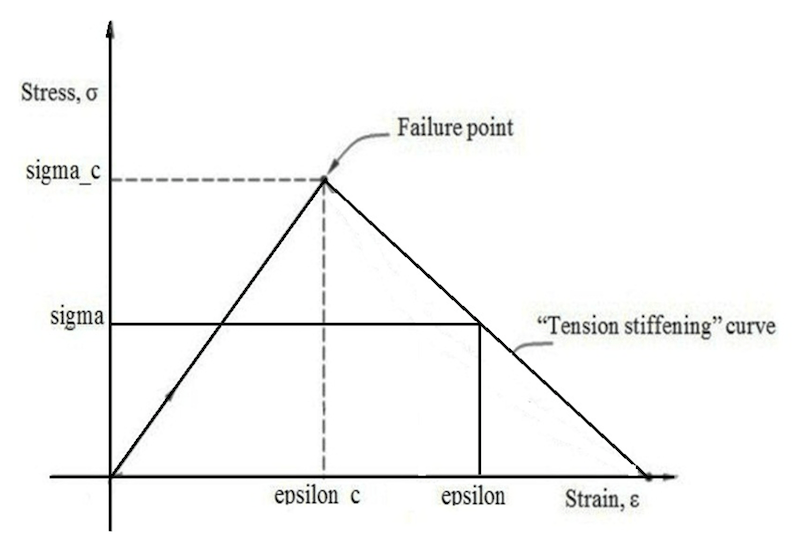
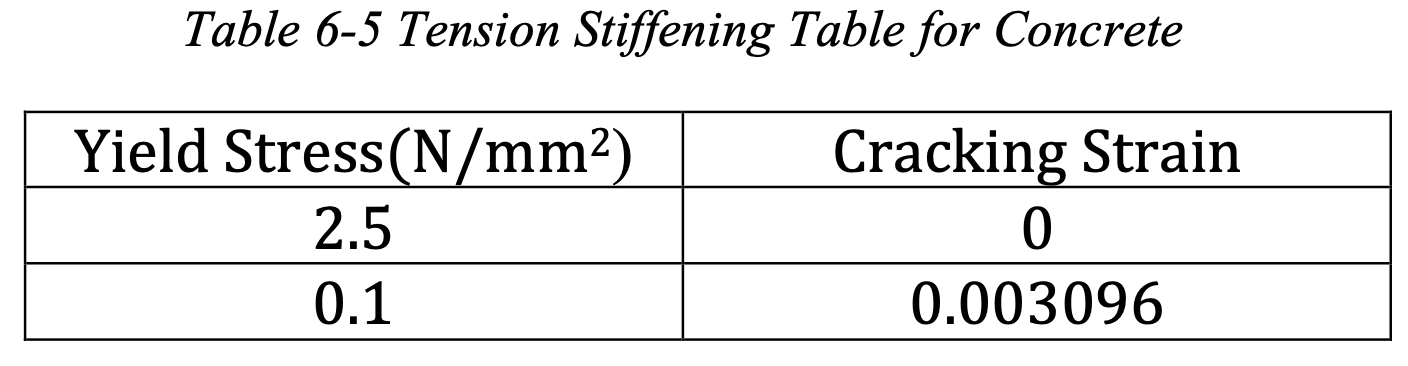
Tensile behavior: Tensile strength was assumed to be 10% of the compressive strength. After the ultimate point the tension softening branch is depicted by a linear plot which also symbolizes the amount of tension stiffening to be considered for the element.
Concrete modelling
Two material models for the purpose of simulation of concrete were studied, namely
- Concrete Smeared Cracking Model
- Concrete Damage Plasticity Model
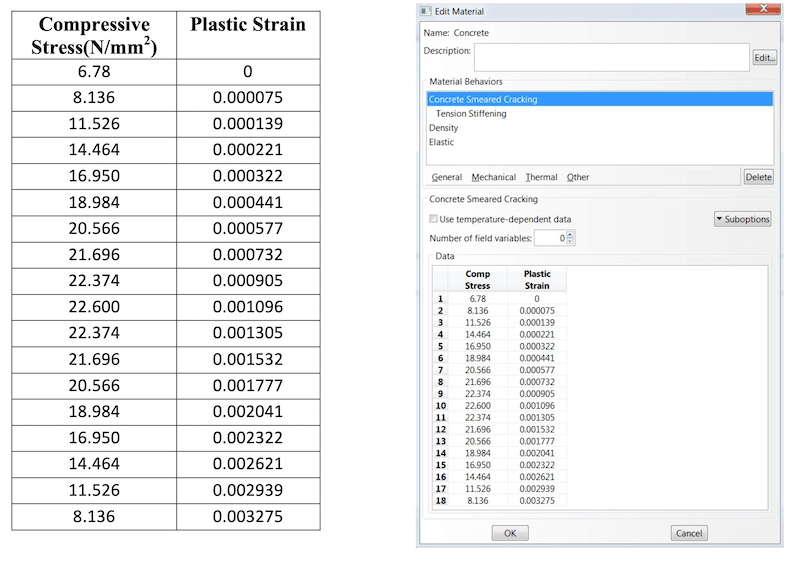
The Concrete Smeared Cracking Model Parameters
Formulation for calculation of the basic material properties have been described above. In this section the input tables have been calculated which are required for defining the material in ABAQUS v6.9.
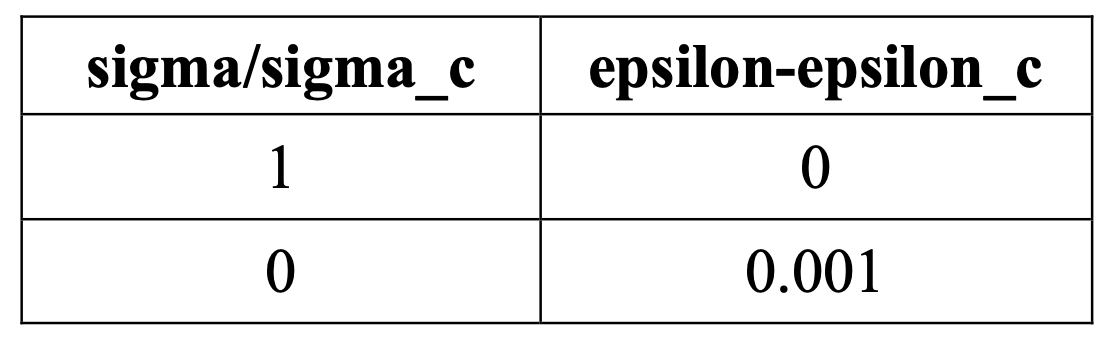
Tension Stiffening
The tension stiffening curve is assumed to be linear. sigma/sigma_c:- Fraction of remaining stress to stress at cracking. epsilon-epsilon_c:- Absolute value of the direct strain minus the direct strain at cracking.
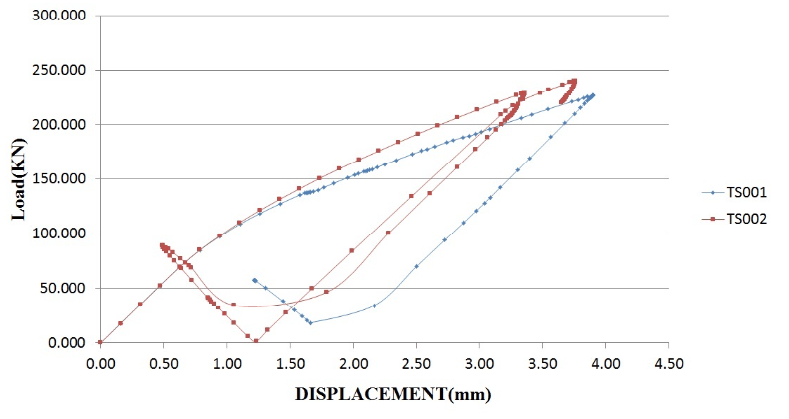
The choice of tension stiffening parameter is important as it helps in stability of the solution process. Giving more tension stiffening to the model will help you get a stable solution but will decrease the amount of straining in the structure and thus the deflections. So a parametric study has to be carried out during the validation process to find the best suited value of this parameter.
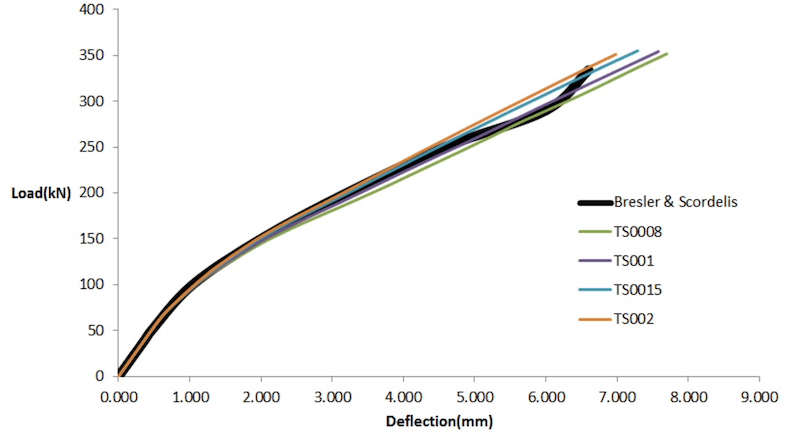
Above figure shows us the load displacement graph of the model with various tension stiffening values compared to the experimental values. Here the strain required to reach a stress value of zero from failure point is termed as TS, so TS001 implies that the strain TS is 0.001. From the graph we can see that a value of TS = 0.001 would give us the best suited results. The same has been used for further study.
Too little (TS < 0.001) tension stiffening leads to early failure of the element which results in negative eigenvalues in the system matrix.
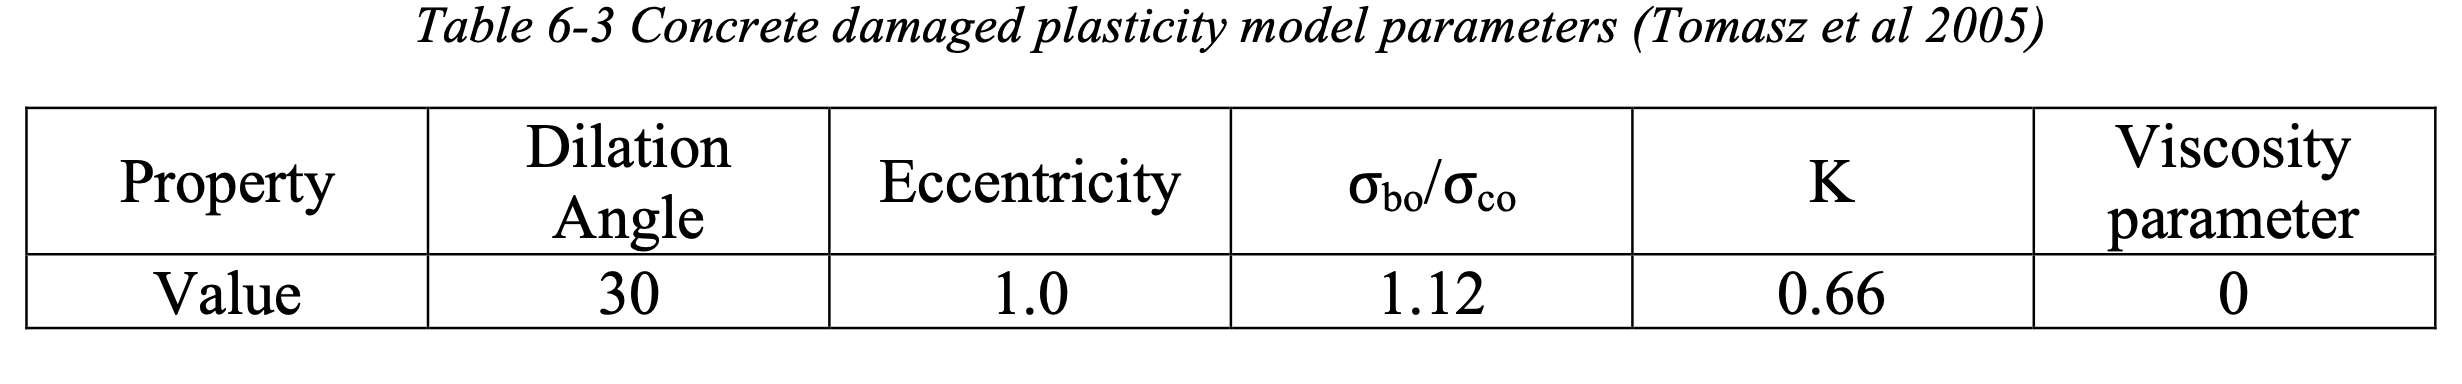
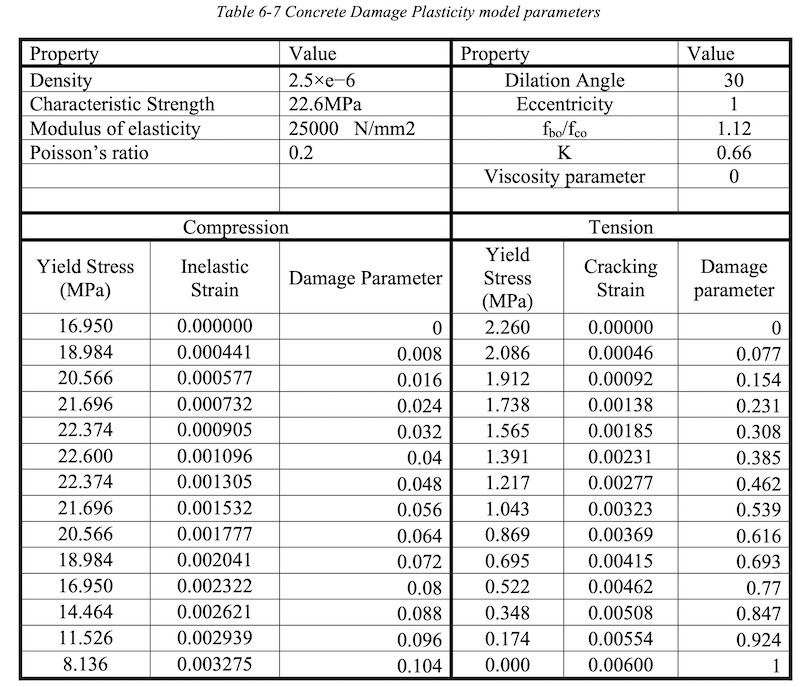
The Concrete Damage Plasticity Model Parameters
Tomasz et al., (2005) conducted laboratory test in order to identify the constitutive parameters of B−50 grade concrete. These parameters are essential in damage plasticity model. In this study the value of dilation angle and eccentricity has been taken from this study. Rests of the values are taken to be the default values as provided by ABAQUS.
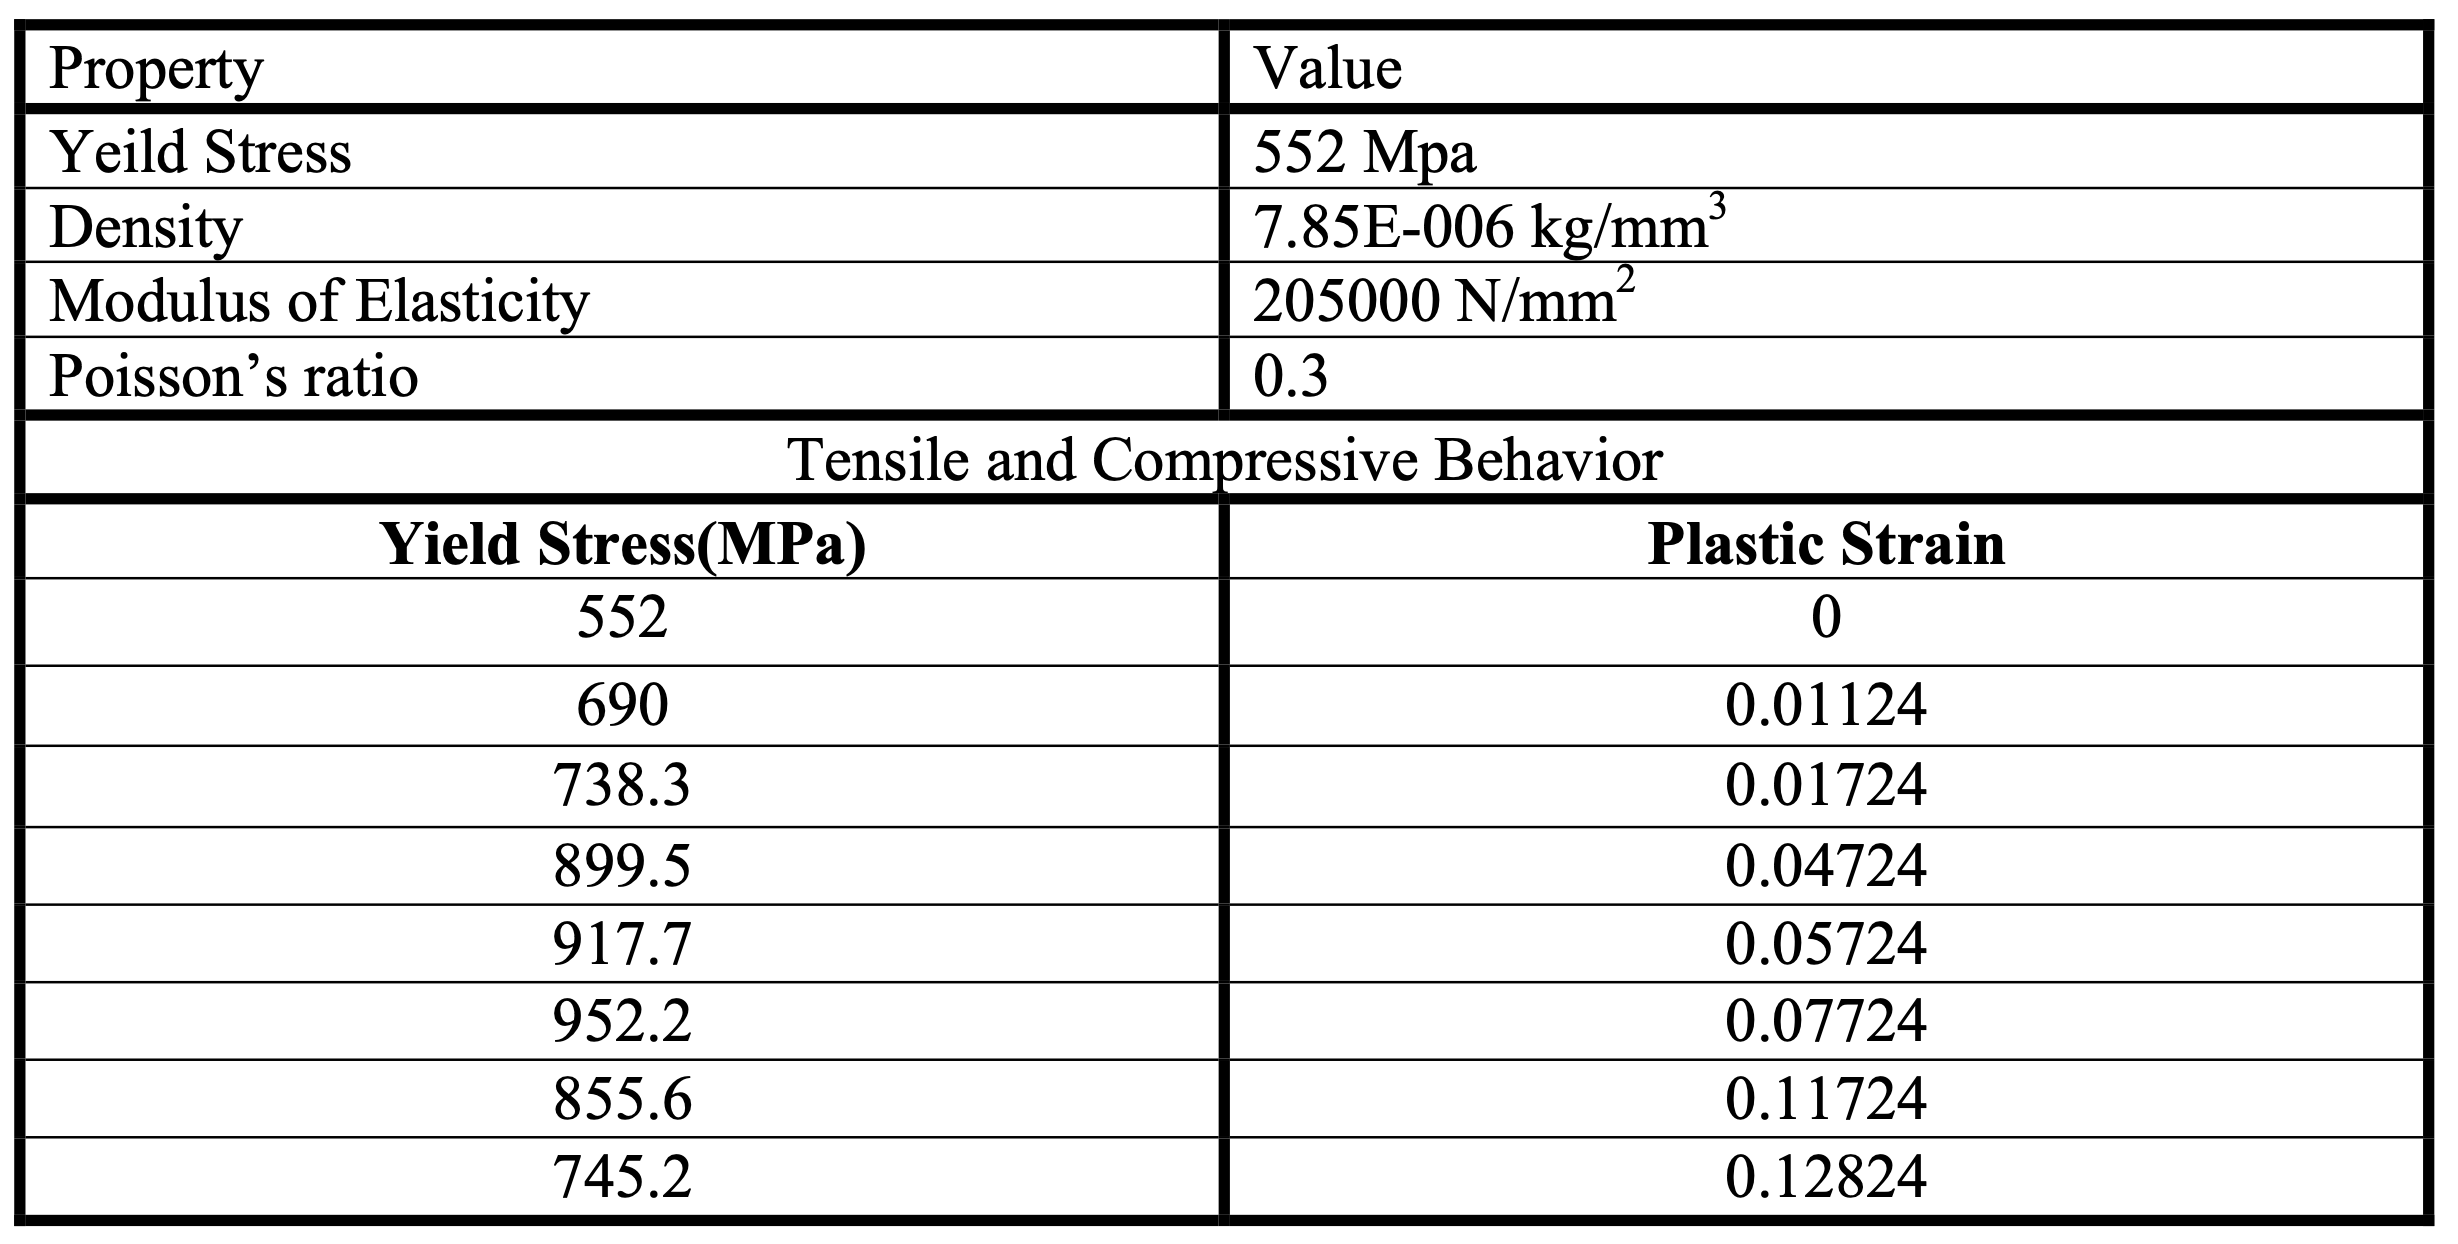
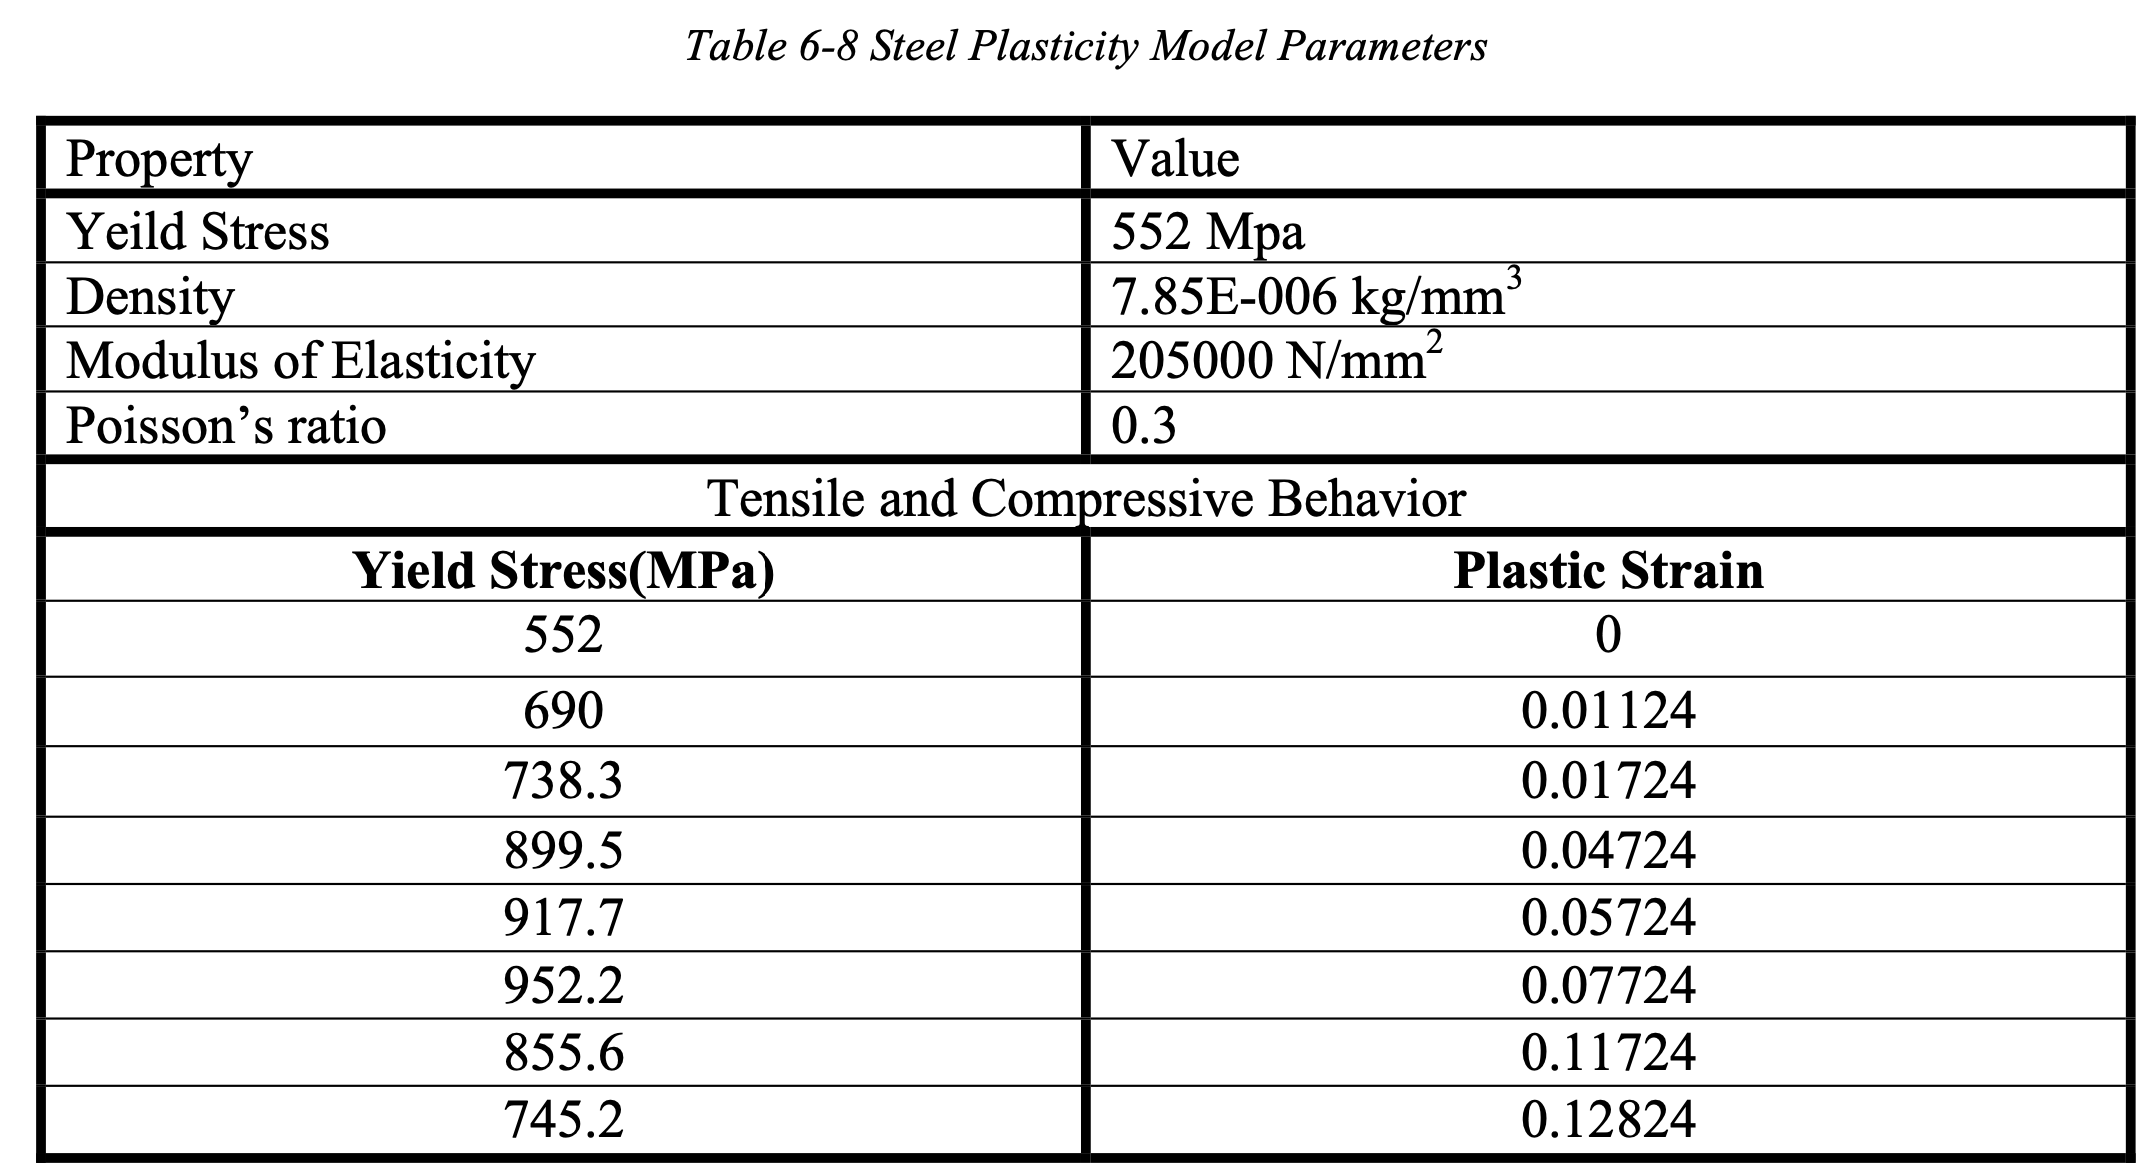
Material Properties for reinforcing steel
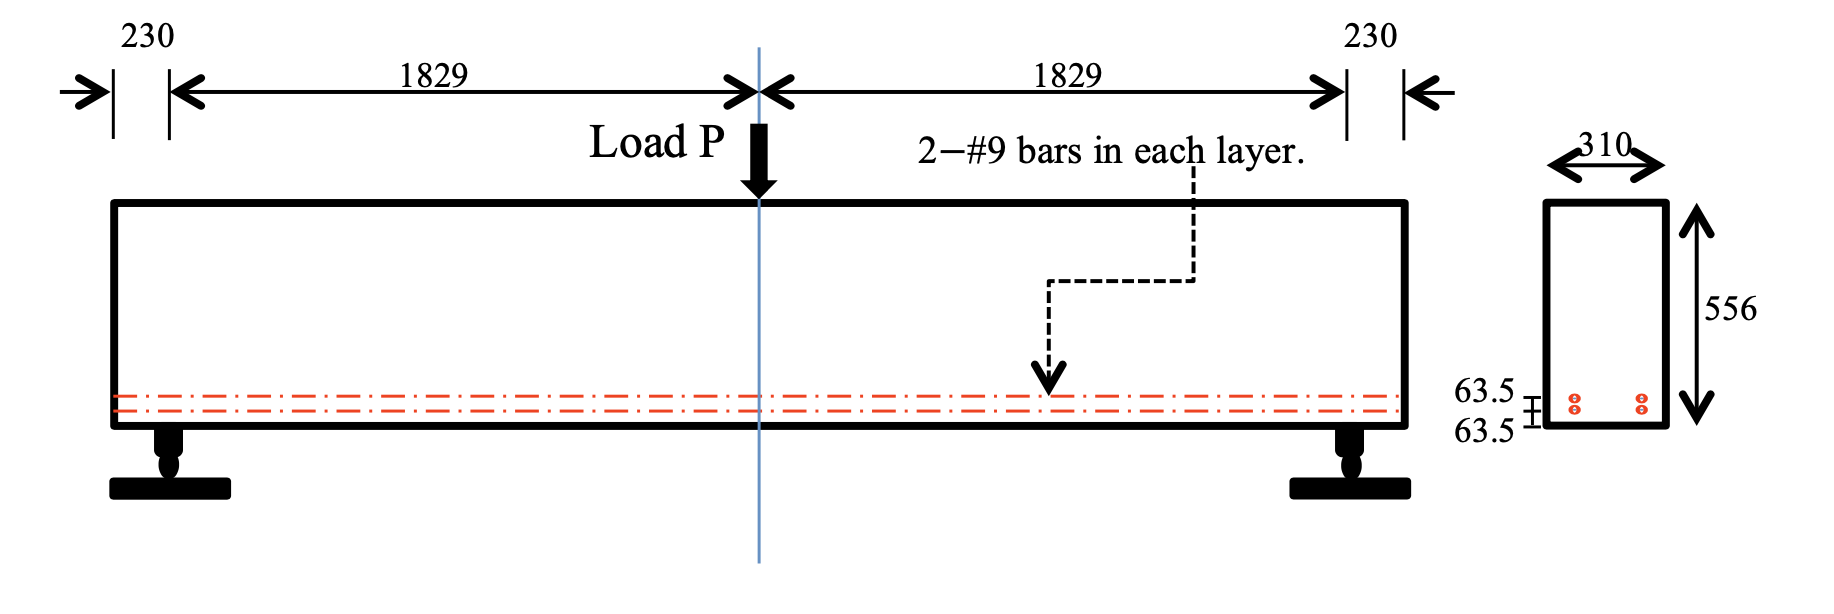
Material properties for reinforcing steel are directly taken from the graphs and values as provided by Bresler and Scordelis (1963).
Validation of Concrete Material Models
A comparison of the experimental results to that of analytical results the material models are made for the purpose of validation. The results are presented in the form of Load v/s deflection plot. The deflections were noted at mid span.
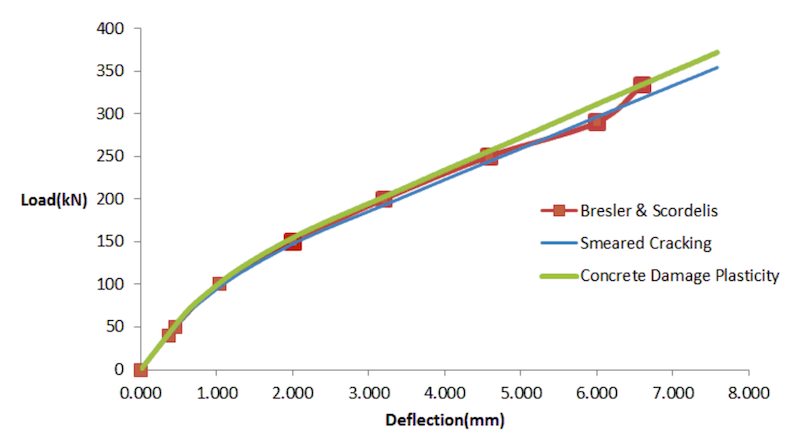
From the above figure we can see that the smeared cracking model and the concrete damage plasticity model almost follows the same equilibrium path as is described by the experiment. It has to be noted that the experiment was carried out in such a way that there was no bond slip, hence the results are in well agreement even with the use of embedded region as constrain between steel and concrete. If there is bond slip then that has to be modelled accordingly.
Analysis of Beam-Column Joint
In the analysis of reinforced concrete moment resisting frames the joints are generally assumed as rigid. In Indian practice, the joint is usually neglected for specific design with attention being restricted to provision of sufficient anchorage for beam longitudinal reinforcement. This may be acceptable when the frame is not subjected to earthquake loads.
But when these frames are subjected to seismic loads the poor design practice of beam column joints is compounded by the high demand imposed by the adjoining flexural members (beams and columns) in the event of mobilizing their inelastic capacities to dissipate seismic energy. Unsafe design and detailing within the joint region jeopardizes the entire structure, even if other structural members conform to the design requirements.
The moment resisting frame is expected to obtain ductility and energy dissipating capacity from flexural yield mechanism at the plastic hinges. Beam-column joint behavior is controlled by bond and shear failure mechanisms, which are weak sources for energy dissipation. The performance criteria for joints under seismic actions may be summarized as follows:
-
The joint should have sufficient strength to enable the maximum capacities to be mobilized in the adjoining flexural members.
-
The degradation of joints should be so limited such that the capacity of the column is not affected in carrying its design loads.
-
The joint deformation should not result in increased storey drift.
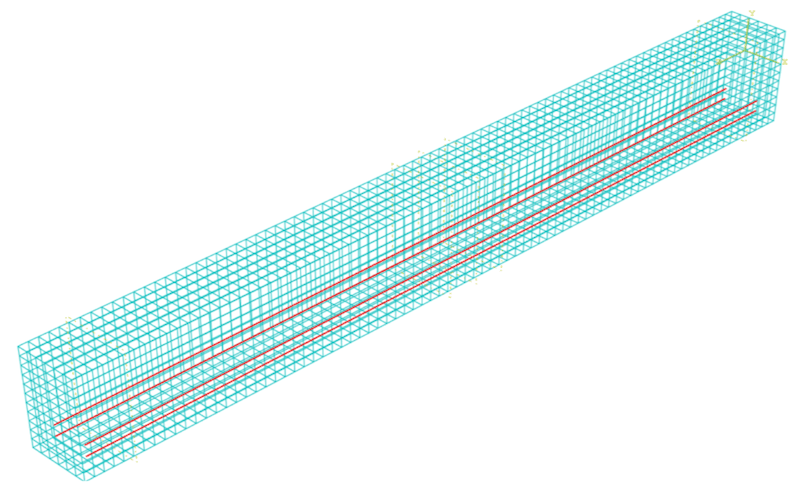
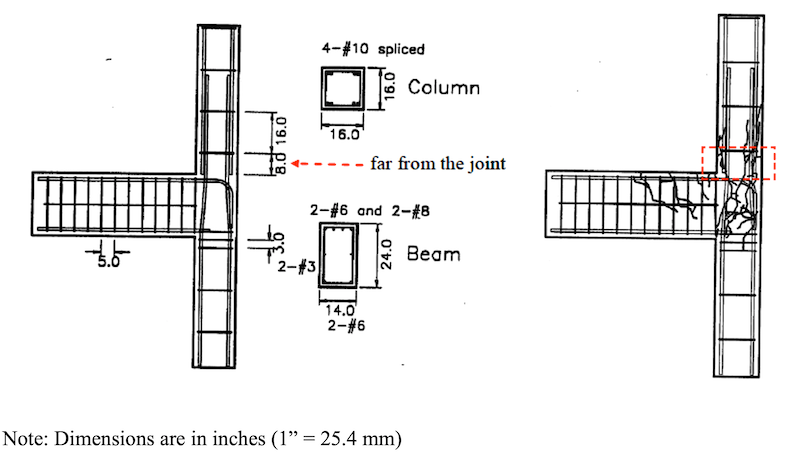
A 3D finite element model of a reinforced concrete beam column joint is discussed in this section. The geometry of this model is taken from the tests conducted by Beres et al. (1992). The concrete was modelled by linear, reduced integration, 3D solid element and reinforcement was modelled by linear, 3D truss element of ABAQUS.
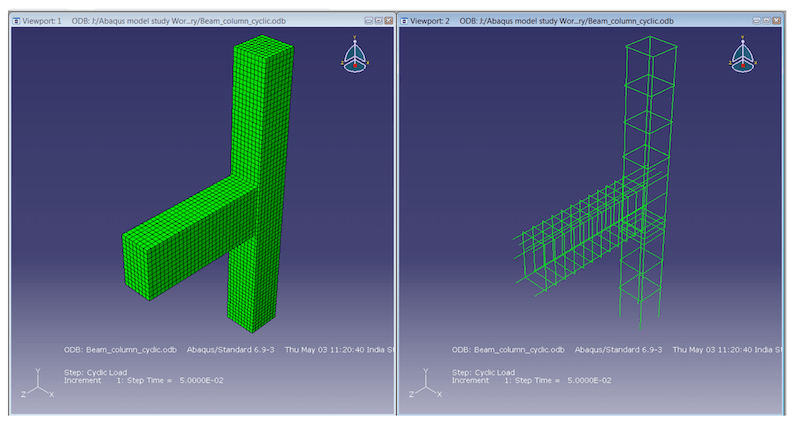
Concrete damage plasticity model is used for concrete and classic metal plasticity for steel.
The applied loading consisted of a shear displacement imposed at the exposed end of the cantilever beam. The load was applied in small increments automatically by ABAQUS to overcome numerical instability difficulties that could have occurred had a large load been applied suddenly. The two ends of the column were taken to be pinned and a perfect bond was assumed between concrete and steel.
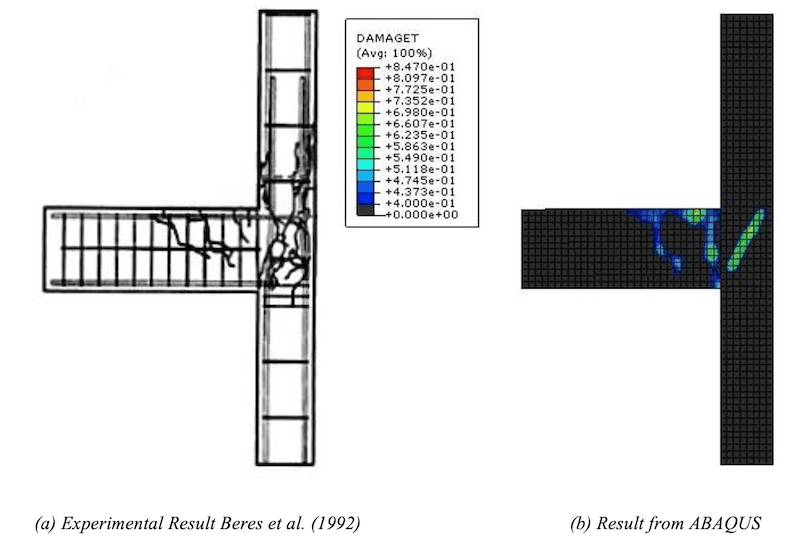
From the above figure we can see that the results are in well agreement with the experiment and the unreinforced beam column joint section fails in shear which could have adverse effect on the overall strength of assembly.
Comparison of Concrete Material Models
A detailed comparison of the two concrete material models is discussed here.
Comparison Based On Equilibrium Path
The first and foremost requirement of a material model is to properly depict the behavior of material and help the solution algorithm to follow exact equilibrium path. This comparison is being done with reference to two beams. The first one which is tested by (Bresler & Scordelis, 1963) is having heavy flexural reinforcement and no shear reinforcement. Another beam tested by (Burns & Seiss, 1962) is also used which is having flexural as well as shear reinforcement.
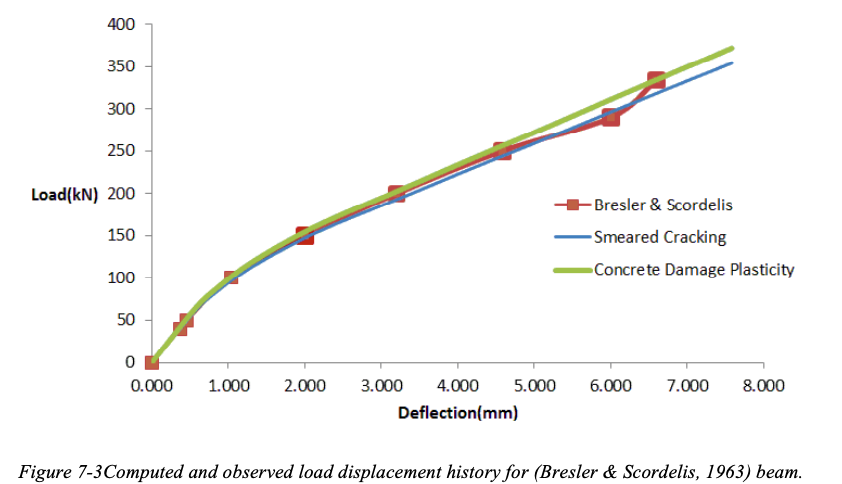
From above figure we can see that both the models behave in a similar fashion when subjected to low loads and they almost follow the same equilibrium path. Hence, for studies in which the structure is subjected to essentially monotonic loading which is significantly less that the ultimate load carrying capacity of its individual structural components, both the models can be used.
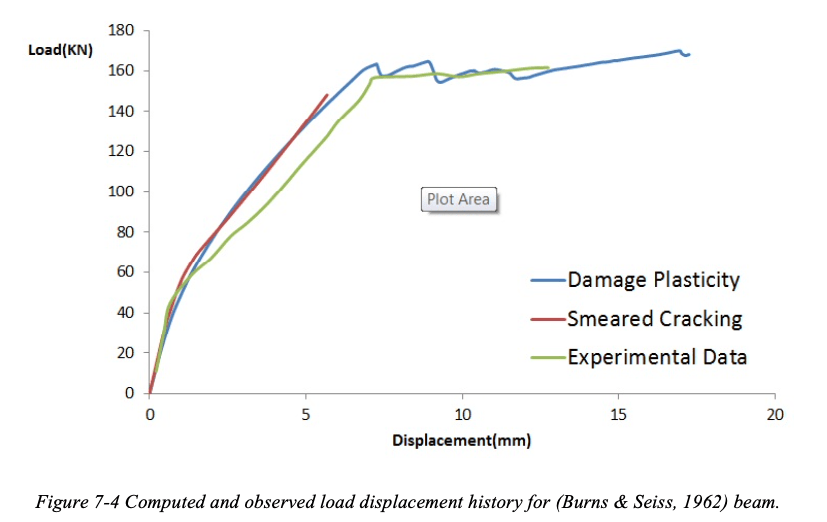
But when simulation of a beam with longitudinal reinforcement and stirrups (Burns & Seiss, 1962) was done it was seen that the response of the model was stiffer than as observed during experiment. Still the deviation of response was under limit and we can see from Figure 7-4 that concrete damage plasticity model was able to predict the response of beam even after the ultimate load has reached whereas with the use of concrete smeared cracking model the analysis stopped at the ultimate point and was not able to continue further. Thus we can conclude that concrete damage plasticity model is more suited for analysis in which we want to study the response of structure to the point of collapse.
Comparison Based On Meshing and Tension Stiffening
The analytical results of the response of reinforced concrete structures are greatly influenced by the size of the finite element mesh and by the amount of tension stiffening of concrete. A sample beam as studied by Burns & Seiss (1962) is modelled here to study the effect of these two parameters on the behavior of beam and accuracy of results.
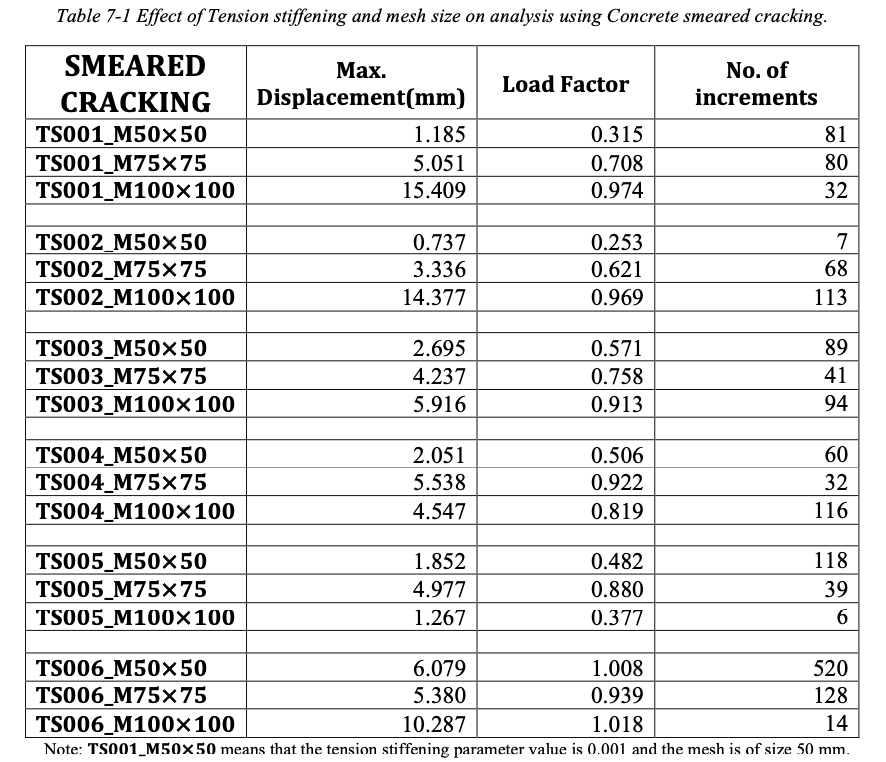
TS001_M50 × 50 means that the tension stiffening parameter value is 0.001 and the mesh is of size 50 mm.
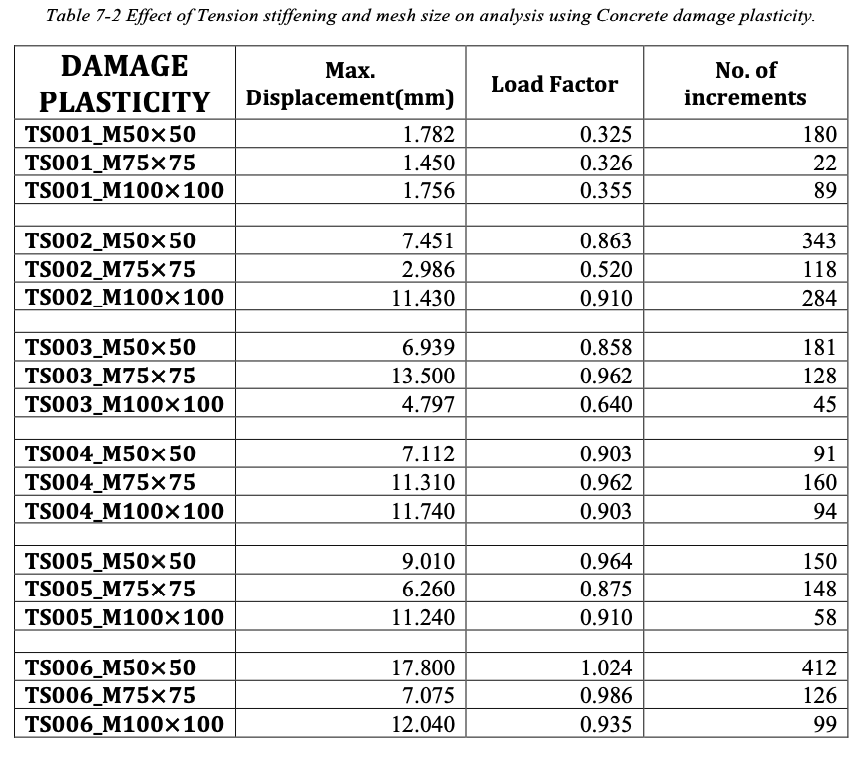
From the above table we can see that results are highly dependent on the mesh size chosen and the amount of tension stiffening provided. Following conclusions are made out of this study,
- Decreasing the mesh size i.e. adding more no of elements, lead to complicacy in the solution algorithm and thus its early termination.
- Too fine mesh would under estimate the capacity of the structure and increase computational effort whereas too coarse mesh giving us a high capacity could easily diverge from exact equilibrium path.
- Increasing the strain softening zone of concrete by modelling it for more tension stiffening usually helps in stabilizing the results,
- But, providing more tension stiffening also leads to overestimation of the stiffness of structure.
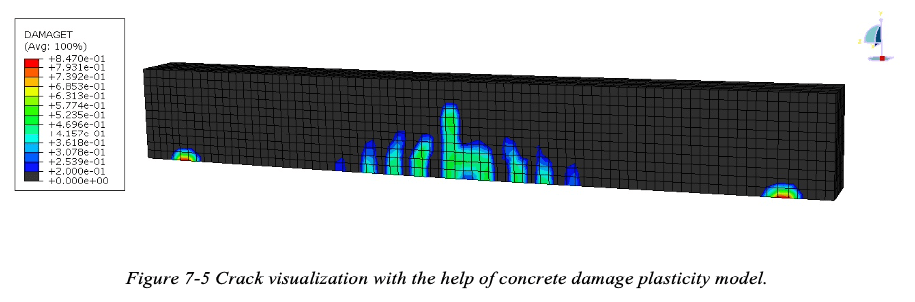
Comparison Based on Crack Visualization
We can visualize the formation of cracks in concrete structural element if we use Concrete Damage plasticity model to define the behavior of concrete. For the purpose of visualization of cracks we have to define the tensile damage parameters discussed in section 3.4.1.3. Crack is assumed to initiates at points where the tensile equivalent plastic strain is greater than zero and the maximum principal plastic strain is positive. The direction of the vector normal to the crack plane is assumed to be parallel to the direction of the maximum principal plastic strain. This direction can be viewed in the Visualization module of Abaqus/CAE with the help of DAMAGET field output variable as shown in Figure 7-5.
Whereas when the analysis is performed by taking smeared cracking model for concrete we cannot visualize cracks with the help of DAMAGET field output variable as there is no provision of providing damage definition while defining the concrete smeared cracking model. Thus DAMAGET variable would give us a contour of zero values throughout when activated in visualization module as shown in Figure 7-6.
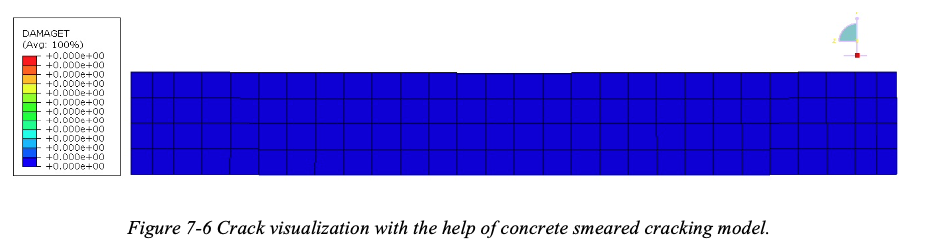
Hence, concrete damage plasticity model should be used if it is required to visualize cracks in the study.
Comparison Based on Response to cyclic behavior
Concrete damage plasticity model uses concepts of isotropic damaged elasticity in combination with isotropic tensile and compressive plasticity to represent the inelastic behavior of concrete and is designed for applications in which concrete can be subjected to monotonic, cyclic, and/or dynamic whereas concrete smeared cracking model is designed for applications in which the concrete is subjected to essentially monotonic straining.
CDP also allows user control of stiffness recovery effects during cyclic load reversals whereas there is no such provision in concrete smeared cracking model.
Thus if the analysis consists of application of cyclic and/or dynamic application of load to the structure than concrete damage plasticity model is more suited for the analysis.
Conclusion
-
Both the concrete models perform well under low strains.
-
The effect of tension-stiffening is important in the analysis of RC structure.
-
The inclusion of tension stiffening is important for avoiding numerical problems in connection with the response of structure post cracking.
-
Tetrahedral elements perform better than hexahedral elements if the region to be
meshed is irregular.
-
Second order hexahedral elements are stiffer than first order hexahedral elements whereas second order tetrahedral elements are less stiff than first order tetrahedral elements.
-
Increasing the element size in a finite element mesh increases the stiffness of model.
-
Tension-stiffening, which accounts for the concrete tensile stresses between cracks, increases the stiffness of the member.
-
Results are highly dependent on the mesh size and amount of tension stiffening
modelled.
-
Crack propagation can only be visualized when Concrete damage plasticity model is used to define the behavior of concrete.
-
For the purpose of ultimate analysis of a structure Concrete damage plasticity model is mode suited.
-
Concrete damage plasticity model also incorporates the permanent damage caused to stiffness of concrete due to straining beyond elastic limit.
-
For cyclic loading Concrete damage plasticity model allows user control of stiffness recovery effects whereas there is no such provision in concrete smeared cracking model.
-
Inclusion of bond−slip behaviour into the model is important as under seismic type excitation there is finite amount of slip between concrete and steel. Modelling the structure with no bond−slip behaviour would lead to overestimation of strength.
Based on the above study it can be concluded that proper understanding of the material model parameters and modelling techniques is important for the simulation of RC structural members under any kind of loading. Especially for the case of non−linear analysis even a slight variation in material model parameters or meshing techniques could lead to significant deviation of analysis results from actual equilibrium path. Thus extensive amount of study must be carried out before choosing a material model for a particular type of analysis.
For conducting a Non−linear seismic analysis of a structure, Concrete Damage Plasticity model is found to be suited to model the behavior of reinforced concrete.
Recommendations for Further Work
In present study various kinds of modelling techniques available in ABAQUS v6.9 to model reinforced concrete structure subjected to monotonic or cyclic loading has been studied in detail. A material model for concrete and steel has been recommended and various methods used to model bond−slip behaviour of reinforced concrete in ABAQUS v6.9 have been documented.
Present study does not incorporate modelling of bond−slip in structural elements. This has led to some overestimation of stiffness as can be seen from results. Therefore for proper and accurate modelling of reinforced concrete there is a need to model this behaviour.
Current work on material models and modelling techniques can be extended to the next phase by conducting a comparative study of the available bond−slip models in ABAQUS v6.9 and then including the best suited bond−slip model in finite element model of RC sub−assemblages. Further a detailed study on full scaled model of RC frames subjected to seismic loading can be conducted with the help of ABAQUS.