import matplotlib as mpl
import matplotlib.pyplot as plt
import numpy as np

mm = 1/25.4  # millimeters in inches
fig = plt.figure(figsize=(2*70*mm,2*50*mm), dpi=200)  # create a figure object
fig.subplots_adjust(left=0.1, right=0.9, top=0.9, bottom=0.15)
ax = fig.add_subplot(1, 1, 1)  # create an axes object in the figure

def colorFader(c1,c2,mix=0): #fade (linear interpolate) from color c1 (at mix=0) to c2 (mix=1)
    c1=np.array(mpl.colors.to_rgb(c1))
    c2=np.array(mpl.colors.to_rgb(c2))
    return mpl.colors.to_hex((1-mix)*c1 + mix*c2)

c1='red' #blue
c2='blue' #green
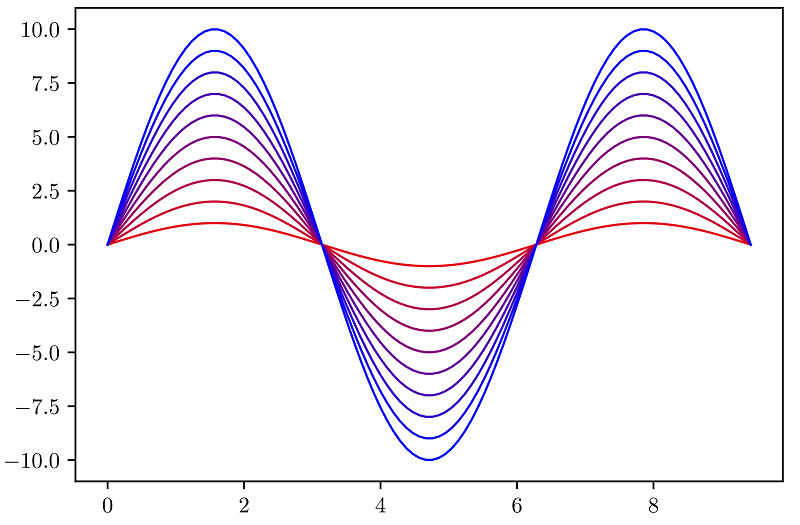
n = 10
x = np.linspace(0,3*np.pi,100)

for i in range(1,n+1):
    ax.plot(x,i*np.sin(x),color=colorFader(c1,c2,i/n),linewidth = 1)
fig.savefig("plot.pdf", format="pdf")