The problem
I need to convert a surface plot generated in python to STL format for better visualization and modification in ParaView.
The solution
Use this library to convert your data into STL format. The process is quite simple. Surface plots in python follow a mesh-grid structure. Thus we can just feed the same data to the surf2stl.write() function to write our data to an STL format. Once written we can visualize and modify it in ParaView. Copy and paste the source file from this repo into your work directory.
import numpy as np
import surf2stl
import matplotlib.pyplot as plt
from mpl_toolkits.mplot3d import Axes3D

x = np.linspace(-6, 6, 30)
y = np.linspace(-6, 6, 30)
X, Y = np.meshgrid(x, y)
Z = np.sin(np.sqrt(X ** 2 + Y ** 2))
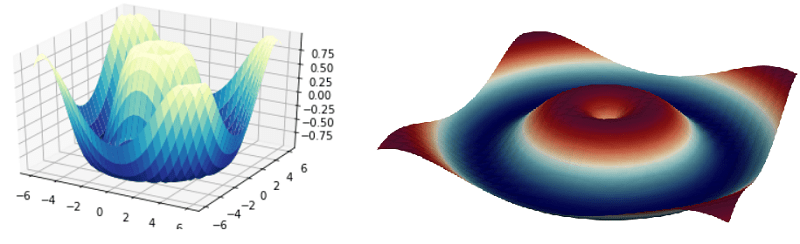
Matplotlib plot
fig = plt.figure()
ax = fig.add_subplot(111, projection='3d')

# Plot the surface.
ax.plot_surface(X, Y, Z, cmap=plt.cm.YlGnBu_r)
plt.show()
Write to STL
surf2stl.write('3d-sinusoidal.stl', X, Y, Z)
Output
Note
If the data does not obey mesh-grid structure then we need to perform triangulation on the point cloud and generate a triangulated surface. Post triangulation either we can use pygmsh or pyvista to write the mesh in XDMF or VTU.